Immigrants from Northern Europe vs Immigrants from Cabo Verde Vision Disability
COMPARE
Immigrants from Northern Europe
Immigrants from Cabo Verde
Vision Disability
Vision Disability Comparison
Immigrants from Northern Europe
Immigrants from Cabo Verde
2.0%
VISION DISABILITY
98.6/ 100
METRIC RATING
71st/ 347
METRIC RANK
2.6%
VISION DISABILITY
0.0/ 100
METRIC RATING
303rd/ 347
METRIC RANK
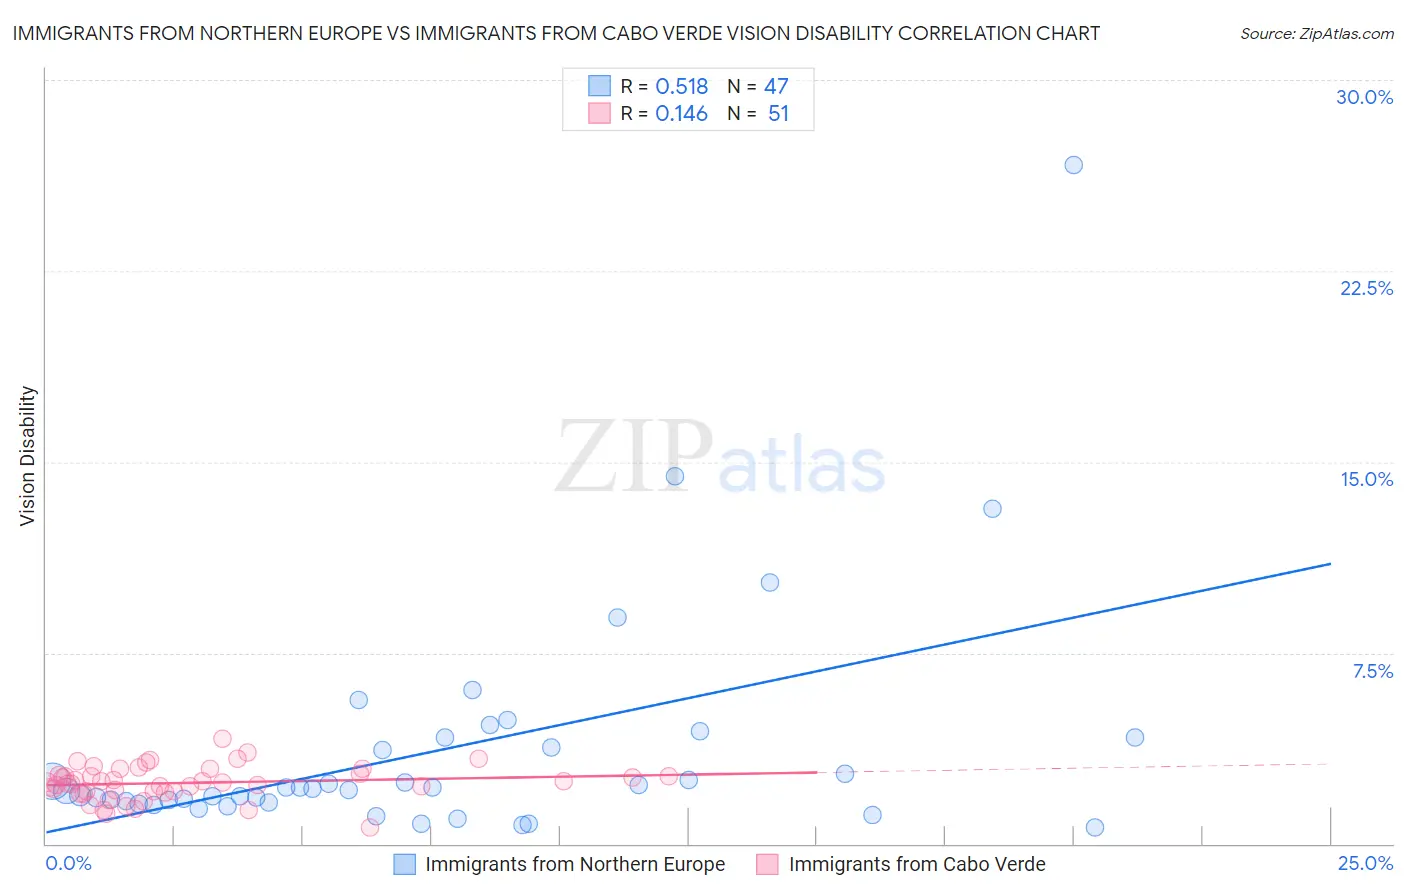
Immigrants from Northern Europe vs Immigrants from Cabo Verde Vision Disability Correlation Chart
The statistical analysis conducted on geographies consisting of 476,530,076 people shows a substantial positive correlation between the proportion of Immigrants from Northern Europe and percentage of population with vision disability in the United States with a correlation coefficient (R) of 0.518 and weighted average of 2.0%. Similarly, the statistical analysis conducted on geographies consisting of 38,135,099 people shows a poor positive correlation between the proportion of Immigrants from Cabo Verde and percentage of population with vision disability in the United States with a correlation coefficient (R) of 0.146 and weighted average of 2.6%, a difference of 27.7%.
Vision Disability Correlation Summary
| Measurement | Immigrants from Northern Europe | Immigrants from Cabo Verde |
| Minimum | 0.66% | 0.65% |
| Maximum | 26.7% | 4.1% |
| Range | 26.0% | 3.5% |
| Mean | 3.7% | 2.4% |
| Median | 2.2% | 2.4% |
| Interquartile 25% (IQ1) | 1.6% | 2.1% |
| Interquartile 75% (IQ3) | 4.2% | 2.8% |
| Interquartile Range (IQR) | 2.5% | 0.70% |
| Standard Deviation (Sample) | 4.5% | 0.67% |
| Standard Deviation (Population) | 4.5% | 0.66% |
Similar Demographics by Vision Disability
Demographics Similar to Immigrants from Northern Europe by Vision Disability
In terms of vision disability, the demographic groups most similar to Immigrants from Northern Europe are Immigrants from Kazakhstan (2.0%, a difference of 0.010%), Russian (2.0%, a difference of 0.030%), Immigrants from France (2.0%, a difference of 0.050%), Immigrants from Czechoslovakia (2.0%, a difference of 0.20%), and Immigrants from Eritrea (2.0%, a difference of 0.25%).
| Demographics | Rating | Rank | Vision Disability |
| Immigrants | Greece | 99.0 /100 | #64 | Exceptional 2.0% |
| Maltese | 98.9 /100 | #65 | Exceptional 2.0% |
| Immigrants | Argentina | 98.9 /100 | #66 | Exceptional 2.0% |
| Immigrants | Northern Africa | 98.8 /100 | #67 | Exceptional 2.0% |
| Immigrants | Czechoslovakia | 98.7 /100 | #68 | Exceptional 2.0% |
| Russians | 98.6 /100 | #69 | Exceptional 2.0% |
| Immigrants | Kazakhstan | 98.6 /100 | #70 | Exceptional 2.0% |
| Immigrants | Northern Europe | 98.6 /100 | #71 | Exceptional 2.0% |
| Immigrants | France | 98.5 /100 | #72 | Exceptional 2.0% |
| Immigrants | Eritrea | 98.4 /100 | #73 | Exceptional 2.0% |
| Palestinians | 98.3 /100 | #74 | Exceptional 2.0% |
| Immigrants | North Macedonia | 98.3 /100 | #75 | Exceptional 2.0% |
| Paraguayans | 98.3 /100 | #76 | Exceptional 2.0% |
| Immigrants | Jordan | 98.3 /100 | #77 | Exceptional 2.0% |
| Immigrants | Eastern Europe | 98.3 /100 | #78 | Exceptional 2.0% |
Demographics Similar to Immigrants from Cabo Verde by Vision Disability
In terms of vision disability, the demographic groups most similar to Immigrants from Cabo Verde are Aleut (2.6%, a difference of 0.13%), Spanish American Indian (2.6%, a difference of 0.22%), Hispanic or Latino (2.6%, a difference of 0.43%), Iroquois (2.6%, a difference of 1.1%), and Immigrants from Dominican Republic (2.6%, a difference of 1.1%).
| Demographics | Rating | Rank | Vision Disability |
| Immigrants | Mexico | 0.0 /100 | #296 | Tragic 2.5% |
| Immigrants | Dominica | 0.0 /100 | #297 | Tragic 2.5% |
| Mexicans | 0.0 /100 | #298 | Tragic 2.5% |
| Cree | 0.0 /100 | #299 | Tragic 2.5% |
| Africans | 0.0 /100 | #300 | Tragic 2.5% |
| Menominee | 0.0 /100 | #301 | Tragic 2.5% |
| Spanish American Indians | 0.0 /100 | #302 | Tragic 2.6% |
| Immigrants | Cabo Verde | 0.0 /100 | #303 | Tragic 2.6% |
| Aleuts | 0.0 /100 | #304 | Tragic 2.6% |
| Hispanics or Latinos | 0.0 /100 | #305 | Tragic 2.6% |
| Iroquois | 0.0 /100 | #306 | Tragic 2.6% |
| Immigrants | Dominican Republic | 0.0 /100 | #307 | Tragic 2.6% |
| Arapaho | 0.0 /100 | #308 | Tragic 2.6% |
| Immigrants | Yemen | 0.0 /100 | #309 | Tragic 2.6% |
| Blackfeet | 0.0 /100 | #310 | Tragic 2.6% |