Moroccan vs Immigrants from Hungary Hearing Disability

COMPARE

Moroccan
Race
Ancestry
AfghanAfricanAlaska NativeAlaskan AthabascanAlbanianAleutAlsatianAmericanApacheArabArapahoArgentineanArmenianAssyrian/Chaldean/SyriacAustralianAustrianBahamianBangladeshiBarbadianBasqueBelgianBelizeanBermudanBhutaneseBlackfeetBolivianBrazilianBritishBritish West IndianBulgarianBurmeseCajunCambodianCanadianCape VerdeanCarpatho RusynCelticCentral AmericanCentral American IndianCherokeeCheyenneChickasawChileanChineseChippewaChoctawColombianColvilleComancheCosta RicanCreeCreekCroatianCrowCubanCypriotCzechCzechoslovakianDanishDelawareDominicanDutchDutch West IndianEastern EuropeanEcuadorianEgyptianEnglishEstonianEthiopianEuropeanFijianFilipinoFinnishFrenchFrench American IndianFrench CanadianGermanGerman RussianGhanaianGreekGuamanian/ChamorroGuatemalanGuyaneseHaitianHmongHonduranHopiHoumaHungarianIcelanderIndian (Asian)IndonesianInupiatIranianIraqiIrishIroquoisIsraeliItalianJamaicanJapaneseJordanianKenyanKiowaKoreanLaotianLatvianLebaneseLiberianLithuanianLumbeeLuxembourgerMacedonianMalaysianMalteseMarshalleseMenomineeMexicanMexican American IndianMongolianMoroccanNative HawaiianNavajoNepaleseNew ZealanderNicaraguanNigerianNorthern EuropeanNorwegianOkinawanOsageOttawaPaiutePakistaniPalestinianPanamanianParaguayanPennsylvania GermanPeruvianPimaPolishPortuguesePotawatomiPuebloPuerto RicanPuget Sound SalishRomanianRussianSalvadoranSamoanScandinavianScotch-IrishScottishSeminoleSenegaleseSerbianShoshoneSierra LeoneanSiouxSlavicSlovakSloveneSomaliSouth AfricanSouth AmericanSouth American IndianSoviet UnionSpaniardSpanishSpanish AmericanSpanish American IndianSri LankanSubsaharan AfricanSudaneseSwedishSwissSyrianTaiwaneseThaiTlingit-HaidaTohono O'OdhamTonganTrinidadian and TobagonianTsimshianTurkishU.S. Virgin IslanderUgandanUkrainianUruguayanUteVenezuelanVietnameseWelshWest IndianYakamaYaquiYugoslavianYumanYup'ikZimbabwean
Immigration
NonimmigrantsImmigrantsAfghanistanAfricaAlbaniaArgentinaArmeniaAsiaAustraliaAustriaBahamasBangladeshBarbadosBelarusBelgiumBelizeBoliviaBosnia and HerzegovinaBrazilBulgariaBurma/MyanmarCabo VerdeCambodiaCameroonCanadaCaribbeanCentral AmericaChileChinaColombiaCongoCosta RicaCroatiaCubaCzechoslovakiaDenmarkDominicaDominican RepublicEastern AfricaEastern AsiaEastern EuropeEcuadorEgyptEl SalvadorEnglandEritreaEthiopiaEuropeFijiFranceGermanyGhanaGreeceGrenadaGuatemalaGuyanaHaitiHondurasHong KongIndiaIndonesiaIranIraqIrelandIsraelItalyJamaicaJapanJordanKazakhstanKenyaKoreaKuwaitLaosLatin AmericaLatviaLebanonLiberiaLithuaniaMalaysiaMexicoMicronesiaMiddle AfricaMoldovaMoroccoNepalNetherlandsNicaraguaNigeriaNorth AmericaNorth MacedoniaNorthern AfricaNorthern EuropeNorwayOceaniaPakistanPanamaPeruPhilippinesPolandPortugalRomaniaRussiaSaudi ArabiaScotlandSenegalSerbiaSierra LeoneSingaporeSomaliaSouth AfricaSouth AmericaSouth Central AsiaSouth Eastern AsiaSouthern EuropeSpainSri LankaSt. Vincent and the GrenadinesSudanSwedenSwitzerlandSyriaTaiwanThailandTrinidad and TobagoTurkeyUgandaUkraineUruguayUzbekistanVenezuelaVietnamWest IndiesWestern AfricaWestern AsiaWestern EuropeYemenZaireZimbabweAzores
Immigrants from Hungary
Race
Ancestry
AfghanAfricanAlaska NativeAlaskan AthabascanAlbanianAleutAlsatianAmericanApacheArabArapahoArgentineanArmenianAssyrian/Chaldean/SyriacAustralianAustrianBahamianBangladeshiBarbadianBasqueBelgianBelizeanBermudanBhutaneseBlackfeetBolivianBrazilianBritishBritish West IndianBulgarianBurmeseCajunCambodianCanadianCape VerdeanCarpatho RusynCelticCentral AmericanCentral American IndianCherokeeCheyenneChickasawChileanChineseChippewaChoctawColombianColvilleComancheCosta RicanCreeCreekCroatianCrowCubanCypriotCzechCzechoslovakianDanishDelawareDominicanDutchDutch West IndianEastern EuropeanEcuadorianEgyptianEnglishEstonianEthiopianEuropeanFijianFilipinoFinnishFrenchFrench American IndianFrench CanadianGermanGerman RussianGhanaianGreekGuamanian/ChamorroGuatemalanGuyaneseHaitianHmongHonduranHopiHoumaHungarianIcelanderIndian (Asian)IndonesianInupiatIranianIraqiIrishIroquoisIsraeliItalianJamaicanJapaneseJordanianKenyanKiowaKoreanLaotianLatvianLebaneseLiberianLithuanianLumbeeLuxembourgerMacedonianMalaysianMalteseMarshalleseMenomineeMexicanMexican American IndianMongolianNative HawaiianNavajoNepaleseNew ZealanderNicaraguanNigerianNorthern EuropeanNorwegianOkinawanOsageOttawaPaiutePakistaniPalestinianPanamanianParaguayanPennsylvania GermanPeruvianPimaPolishPortuguesePotawatomiPuebloPuerto RicanPuget Sound SalishRomanianRussianSalvadoranSamoanScandinavianScotch-IrishScottishSeminoleSenegaleseSerbianShoshoneSierra LeoneanSiouxSlavicSlovakSloveneSomaliSouth AfricanSouth AmericanSouth American IndianSoviet UnionSpaniardSpanishSpanish AmericanSpanish American IndianSri LankanSubsaharan AfricanSudaneseSwedishSwissSyrianTaiwaneseThaiTlingit-HaidaTohono O'OdhamTonganTrinidadian and TobagonianTsimshianTurkishU.S. Virgin IslanderUgandanUkrainianUruguayanUteVenezuelanVietnameseWelshWest IndianYakamaYaquiYugoslavianYumanYup'ikZimbabwean
Immigration
NonimmigrantsImmigrantsAfghanistanAfricaAlbaniaArgentinaArmeniaAsiaAustraliaAustriaBahamasBangladeshBarbadosBelarusBelgiumBelizeBoliviaBosnia and HerzegovinaBrazilBulgariaBurma/MyanmarCabo VerdeCambodiaCameroonCanadaCaribbeanCentral AmericaChileChinaColombiaCongoCosta RicaCroatiaCubaCzechoslovakiaDenmarkDominicaDominican RepublicEastern AfricaEastern AsiaEastern EuropeEcuadorEgyptEl SalvadorEnglandEritreaEthiopiaEuropeFijiFranceGermanyGhanaGreeceGrenadaGuatemalaGuyanaHaitiHondurasHong KongHungaryIndiaIndonesiaIranIraqIrelandIsraelItalyJamaicaJapanJordanKazakhstanKenyaKoreaKuwaitLaosLatin AmericaLatviaLebanonLiberiaLithuaniaMalaysiaMexicoMicronesiaMiddle AfricaMoldovaMoroccoNepalNetherlandsNicaraguaNigeriaNorth AmericaNorth MacedoniaNorthern AfricaNorthern EuropeNorwayOceaniaPakistanPanamaPeruPhilippinesPolandPortugalRomaniaRussiaSaudi ArabiaScotlandSenegalSerbiaSierra LeoneSingaporeSomaliaSouth AfricaSouth AmericaSouth Central AsiaSouth Eastern AsiaSouthern EuropeSpainSri LankaSt. Vincent and the GrenadinesSudanSwedenSwitzerlandSyriaTaiwanThailandTrinidad and TobagoTurkeyUgandaUkraineUruguayUzbekistanVenezuelaVietnamWest IndiesWestern AfricaWestern AsiaWestern EuropeYemenZaireZimbabweAzores
Hearing Disability
Income
Poverty
Unemployment
Labor Participation
Family Structure
Vehicle Availability
Education Level
Disability

Hearing Disability Comparison

Moroccans

Immigrants from Hungary

Exceptional
Poor
2.8%
HEARING DISABILITY
93.9/ 100
METRIC RATING
105th/ 347
METRIC RANK
3.1%
HEARING DISABILITY
12.5/ 100
METRIC RATING
209th/ 347
METRIC RANK

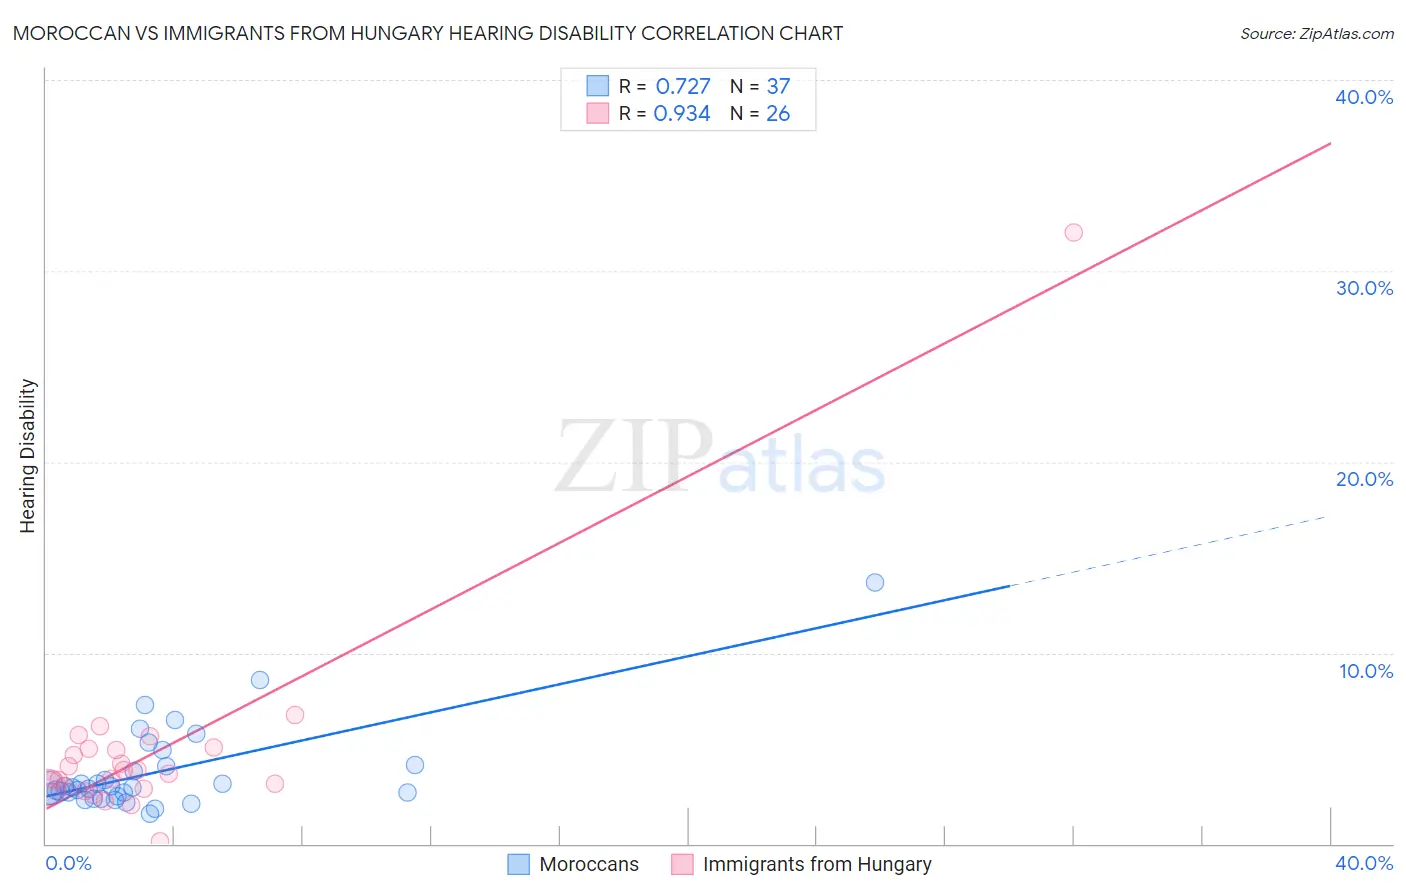
Moroccan vs Immigrants from Hungary Hearing Disability Correlation Chart

The statistical analysis conducted on geographies consisting of 201,794,286 people shows a strong positive correlation between the proportion of Moroccans and percentage of population with hearing disability in the United States with a correlation coefficient (R) of 0.727 and weighted average of 2.8%. Similarly, the statistical analysis conducted on geographies consisting of 195,680,611 people shows a near-perfect positive correlation between the proportion of Immigrants from Hungary and percentage of population with hearing disability in the United States with a correlation coefficient (R) of 0.934 and weighted average of 3.1%, a difference of 11.8%.
Moroccan vs Immigrants from Hungary Hearing Disability

Hearing Disability Correlation Summary

MeasurementMoroccanImmigrants from Hungary
Minimum1.6%0.15%
Maximum13.7%32.0%
Range12.1%31.9%
Mean3.8%4.9%
Median3.0%3.8%
Interquartile 25% (IQ1)2.6%2.9%
Interquartile 75% (IQ3)4.1%5.0%
Interquartile Range (IQR)1.5%2.0%
Standard Deviation (Sample)2.3%5.7%
Standard Deviation (Population)2.3%5.6%

Similar Demographics by Hearing Disability

Demographics Similar to Moroccans by Hearing Disability

In terms of hearing disability, the demographic groups most similar to Moroccans are Burmese (2.8%, a difference of 0.11%), Honduran (2.8%, a difference of 0.24%), Immigrants from Chile (2.8%, a difference of 0.24%), Guatemalan (2.8%, a difference of 0.32%), and Immigrants from Indonesia (2.8%, a difference of 0.38%).
DemographicsRating | RankHearing Disability
Immigrants | Honduras
95.1
/100
|
#98
Exceptional
2.8%
Immigrants | Guatemala
95.1
/100
|
#99
Exceptional
2.8%
Immigrants | Eastern Africa
95.0
/100
|
#100
Exceptional
2.8%
Immigrants | Spain
94.9
/100
|
#101
Exceptional
2.8%
Taiwanese
94.8
/100
|
#102
Exceptional
2.8%
Immigrants | Indonesia
94.7
/100
|
#103
Exceptional
2.8%
Burmese
94.2
/100
|
#104
Exceptional
2.8%
Moroccans
93.9
/100
|
#105
Exceptional
2.8%
Hondurans
93.4
/100
|
#106
Exceptional
2.8%
Immigrants | Chile
93.4
/100
|
#107
Exceptional
2.8%
Guatemalans
93.2
/100
|
#108
Exceptional
2.8%
Turks
93.0
/100
|
#109
Exceptional
2.8%
Cypriots
92.9
/100
|
#110
Exceptional
2.8%
Immigrants | Yemen
92.7
/100
|
#111
Exceptional
2.8%
U.S. Virgin Islanders
92.5
/100
|
#112
Exceptional
2.8%

Demographics Similar to Immigrants from Hungary by Hearing Disability

In terms of hearing disability, the demographic groups most similar to Immigrants from Hungary are Immigrants from Latvia (3.1%, a difference of 0.040%), Cape Verdean (3.1%, a difference of 0.050%), Romanian (3.1%, a difference of 0.080%), Pakistani (3.1%, a difference of 0.29%), and Immigrants from Iraq (3.1%, a difference of 0.44%).
DemographicsRating | RankHearing Disability
Immigrants | Thailand
16.4
/100
|
#202
Poor
3.1%
Immigrants | Denmark
16.2
/100
|
#203
Poor
3.1%
Immigrants | Czechoslovakia
15.9
/100
|
#204
Poor
3.1%
Alsatians
15.9
/100
|
#205
Poor
3.1%
Eastern Europeans
15.5
/100
|
#206
Poor
3.1%
Hispanics or Latinos
15.1
/100
|
#207
Poor
3.1%
Immigrants | Latvia
12.7
/100
|
#208
Poor
3.1%
Immigrants | Hungary
12.5
/100
|
#209
Poor
3.1%
Cape Verdeans
12.2
/100
|
#210
Poor
3.1%
Romanians
12.1
/100
|
#211
Poor
3.1%
Pakistanis
11.1
/100
|
#212
Poor
3.1%
Immigrants | Iraq
10.5
/100
|
#213
Poor
3.1%
Australians
8.1
/100
|
#214
Tragic
3.2%
Bangladeshis
8.1
/100
|
#215
Tragic
3.2%
Immigrants | Norway
7.3
/100
|
#216
Tragic
3.2%