Moroccan vs Immigrants from Europe Hearing Disability
COMPARE
Moroccan
Immigrants from Europe
Hearing Disability
Hearing Disability Comparison
Moroccans
Immigrants from Europe
2.8%
HEARING DISABILITY
93.9/ 100
METRIC RATING
105th/ 347
METRIC RANK
3.1%
HEARING DISABILITY
22.9/ 100
METRIC RATING
196th/ 347
METRIC RANK
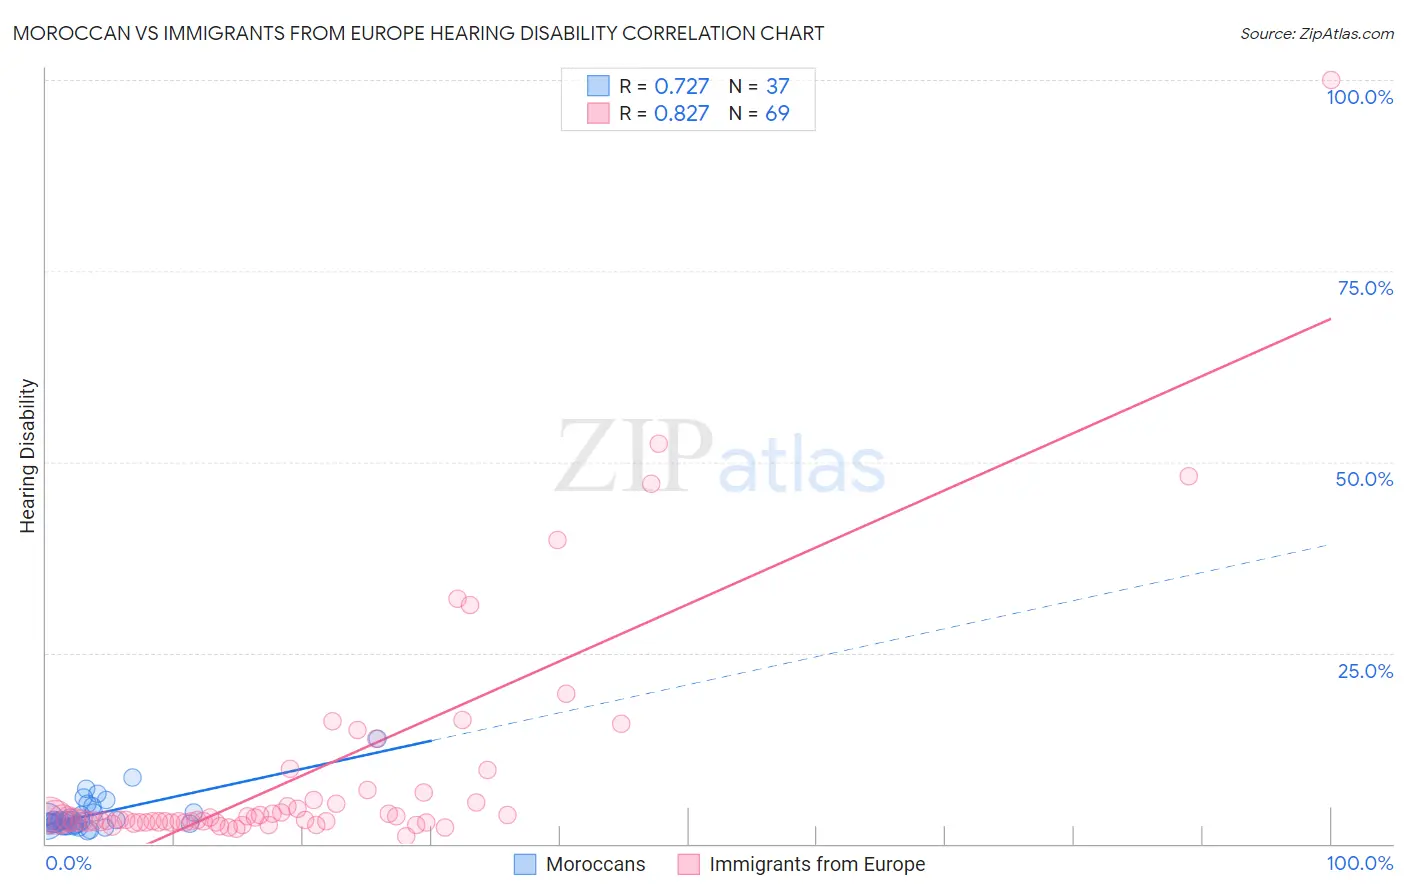
Moroccan vs Immigrants from Europe Hearing Disability Correlation Chart
The statistical analysis conducted on geographies consisting of 201,794,286 people shows a strong positive correlation between the proportion of Moroccans and percentage of population with hearing disability in the United States with a correlation coefficient (R) of 0.727 and weighted average of 2.8%. Similarly, the statistical analysis conducted on geographies consisting of 546,917,767 people shows a very strong positive correlation between the proportion of Immigrants from Europe and percentage of population with hearing disability in the United States with a correlation coefficient (R) of 0.827 and weighted average of 3.1%, a difference of 9.9%.
Hearing Disability Correlation Summary
| Measurement | Moroccan | Immigrants from Europe |
| Minimum | 1.6% | 0.95% |
| Maximum | 13.7% | 100.0% |
| Range | 12.1% | 99.1% |
| Mean | 3.8% | 9.4% |
| Median | 3.0% | 3.2% |
| Interquartile 25% (IQ1) | 2.6% | 2.9% |
| Interquartile 75% (IQ3) | 4.1% | 6.2% |
| Interquartile Range (IQR) | 1.5% | 3.3% |
| Standard Deviation (Sample) | 2.3% | 15.9% |
| Standard Deviation (Population) | 2.3% | 15.8% |
Similar Demographics by Hearing Disability
Demographics Similar to Moroccans by Hearing Disability
In terms of hearing disability, the demographic groups most similar to Moroccans are Burmese (2.8%, a difference of 0.11%), Honduran (2.8%, a difference of 0.24%), Immigrants from Chile (2.8%, a difference of 0.24%), Guatemalan (2.8%, a difference of 0.32%), and Immigrants from Indonesia (2.8%, a difference of 0.38%).
| Demographics | Rating | Rank | Hearing Disability |
| Immigrants | Honduras | 95.1 /100 | #98 | Exceptional 2.8% |
| Immigrants | Guatemala | 95.1 /100 | #99 | Exceptional 2.8% |
| Immigrants | Eastern Africa | 95.0 /100 | #100 | Exceptional 2.8% |
| Immigrants | Spain | 94.9 /100 | #101 | Exceptional 2.8% |
| Taiwanese | 94.8 /100 | #102 | Exceptional 2.8% |
| Immigrants | Indonesia | 94.7 /100 | #103 | Exceptional 2.8% |
| Burmese | 94.2 /100 | #104 | Exceptional 2.8% |
| Moroccans | 93.9 /100 | #105 | Exceptional 2.8% |
| Hondurans | 93.4 /100 | #106 | Exceptional 2.8% |
| Immigrants | Chile | 93.4 /100 | #107 | Exceptional 2.8% |
| Guatemalans | 93.2 /100 | #108 | Exceptional 2.8% |
| Turks | 93.0 /100 | #109 | Exceptional 2.8% |
| Cypriots | 92.9 /100 | #110 | Exceptional 2.8% |
| Immigrants | Yemen | 92.7 /100 | #111 | Exceptional 2.8% |
| U.S. Virgin Islanders | 92.5 /100 | #112 | Exceptional 2.8% |
Demographics Similar to Immigrants from Europe by Hearing Disability
In terms of hearing disability, the demographic groups most similar to Immigrants from Europe are Spanish American Indian (3.1%, a difference of 0.16%), South African (3.1%, a difference of 0.21%), Immigrants from Bosnia and Herzegovina (3.1%, a difference of 0.30%), Immigrants from Croatia (3.1%, a difference of 0.32%), and Macedonian (3.1%, a difference of 0.51%).
| Demographics | Rating | Rank | Hearing Disability |
| Africans | 32.9 /100 | #189 | Fair 3.0% |
| Immigrants | South Africa | 31.1 /100 | #190 | Fair 3.1% |
| Immigrants | Switzerland | 28.8 /100 | #191 | Fair 3.1% |
| Koreans | 27.6 /100 | #192 | Fair 3.1% |
| Macedonians | 27.0 /100 | #193 | Fair 3.1% |
| South Africans | 24.5 /100 | #194 | Fair 3.1% |
| Spanish American Indians | 24.1 /100 | #195 | Fair 3.1% |
| Immigrants | Europe | 22.9 /100 | #196 | Fair 3.1% |
| Immigrants | Bosnia and Herzegovina | 20.6 /100 | #197 | Fair 3.1% |
| Immigrants | Croatia | 20.5 /100 | #198 | Fair 3.1% |
| Syrians | 19.2 /100 | #199 | Poor 3.1% |
| Immigrants | North Macedonia | 19.1 /100 | #200 | Poor 3.1% |
| Iraqis | 19.0 /100 | #201 | Poor 3.1% |
| Immigrants | Thailand | 16.4 /100 | #202 | Poor 3.1% |
| Immigrants | Denmark | 16.2 /100 | #203 | Poor 3.1% |