Mexican vs Palestinian Disability
COMPARE
Mexican
Palestinian
Disability
Disability Comparison
Mexicans
Palestinians
12.1%
DISABILITY
3.7/ 100
METRIC RATING
224th/ 347
METRIC RANK
11.1%
DISABILITY
98.9/ 100
METRIC RATING
87th/ 347
METRIC RANK
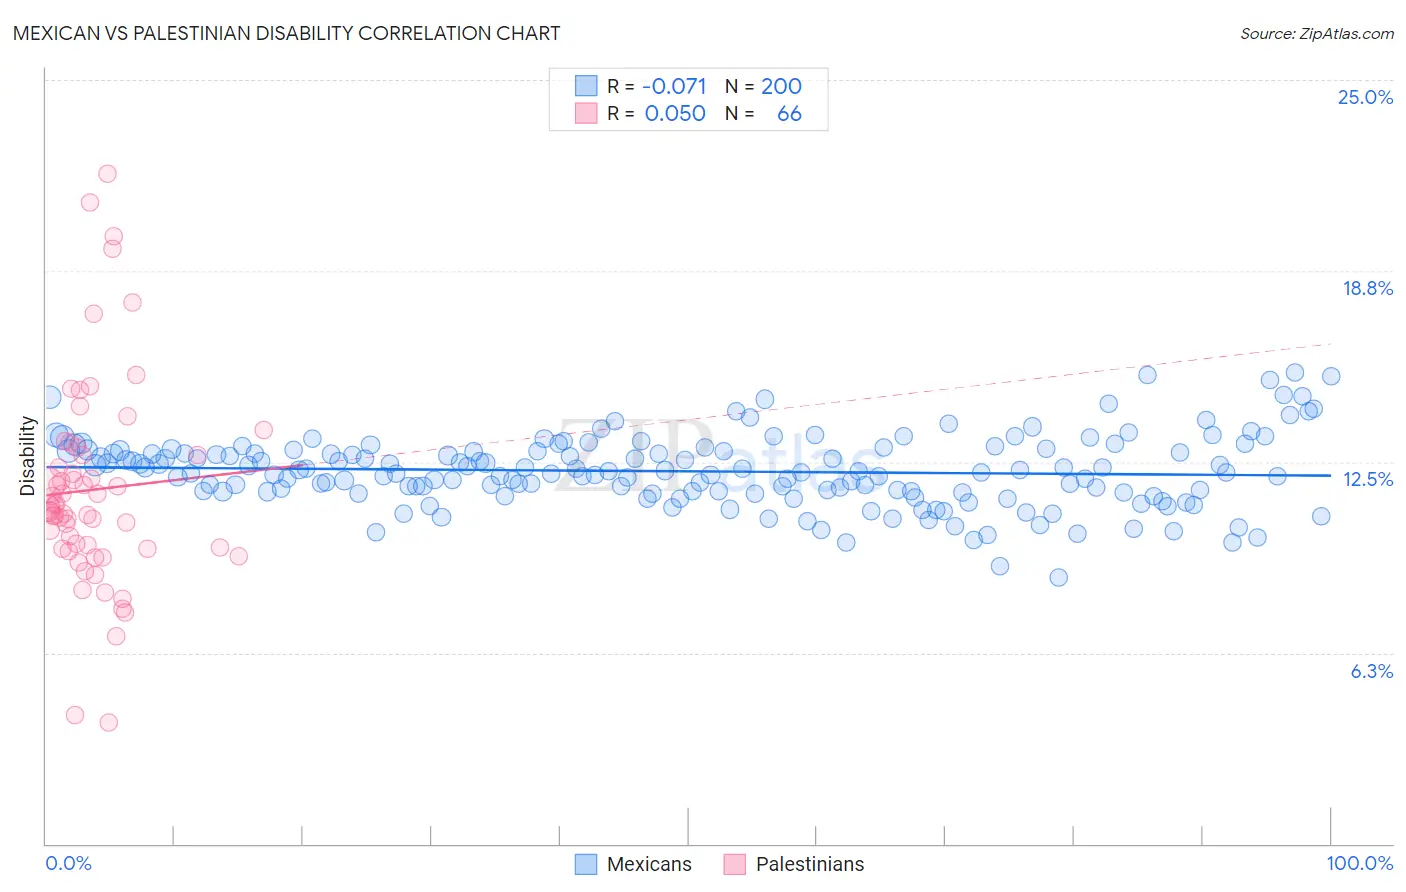
Mexican vs Palestinian Disability Correlation Chart
The statistical analysis conducted on geographies consisting of 565,156,927 people shows a slight negative correlation between the proportion of Mexicans and percentage of population with a disability in the United States with a correlation coefficient (R) of -0.071 and weighted average of 12.1%. Similarly, the statistical analysis conducted on geographies consisting of 216,463,663 people shows no correlation between the proportion of Palestinians and percentage of population with a disability in the United States with a correlation coefficient (R) of 0.050 and weighted average of 11.1%, a difference of 9.0%.
Disability Correlation Summary
| Measurement | Mexican | Palestinian |
| Minimum | 8.7% | 4.0% |
| Maximum | 15.4% | 21.9% |
| Range | 6.7% | 18.0% |
| Mean | 12.2% | 11.6% |
| Median | 12.2% | 11.0% |
| Interquartile 25% (IQ1) | 11.5% | 9.7% |
| Interquartile 75% (IQ3) | 12.9% | 12.7% |
| Interquartile Range (IQR) | 1.3% | 3.1% |
| Standard Deviation (Sample) | 1.2% | 3.4% |
| Standard Deviation (Population) | 1.2% | 3.4% |
Similar Demographics by Disability
Demographics Similar to Mexicans by Disability
In terms of disability, the demographic groups most similar to Mexicans are Hispanic or Latino (12.1%, a difference of 0.060%), Senegalese (12.1%, a difference of 0.080%), Spanish American Indian (12.1%, a difference of 0.10%), Jamaican (12.1%, a difference of 0.13%), and Northern European (12.1%, a difference of 0.14%).
| Demographics | Rating | Rank | Disability |
| Immigrants | North America | 5.3 /100 | #217 | Tragic 12.1% |
| Immigrants | Jamaica | 5.0 /100 | #218 | Tragic 12.1% |
| Croatians | 4.9 /100 | #219 | Tragic 12.1% |
| Immigrants | Bahamas | 4.7 /100 | #220 | Tragic 12.1% |
| Northern Europeans | 4.2 /100 | #221 | Tragic 12.1% |
| Spanish American Indians | 4.1 /100 | #222 | Tragic 12.1% |
| Hispanics or Latinos | 3.9 /100 | #223 | Tragic 12.1% |
| Mexicans | 3.7 /100 | #224 | Tragic 12.1% |
| Senegalese | 3.5 /100 | #225 | Tragic 12.1% |
| Jamaicans | 3.3 /100 | #226 | Tragic 12.1% |
| Alsatians | 3.3 /100 | #227 | Tragic 12.1% |
| West Indians | 2.9 /100 | #228 | Tragic 12.2% |
| Inupiat | 2.8 /100 | #229 | Tragic 12.2% |
| Samoans | 2.6 /100 | #230 | Tragic 12.2% |
| Malaysians | 2.5 /100 | #231 | Tragic 12.2% |
Demographics Similar to Palestinians by Disability
In terms of disability, the demographic groups most similar to Palestinians are Immigrants from Belarus (11.1%, a difference of 0.040%), Immigrants from Russia (11.1%, a difference of 0.040%), Immigrants from Sierra Leone (11.1%, a difference of 0.19%), Immigrants from Switzerland (11.1%, a difference of 0.20%), and Chilean (11.1%, a difference of 0.23%).
| Demographics | Rating | Rank | Disability |
| Immigrants | Ireland | 99.3 /100 | #80 | Exceptional 11.1% |
| Immigrants | Poland | 99.1 /100 | #81 | Exceptional 11.1% |
| Chileans | 99.1 /100 | #82 | Exceptional 11.1% |
| Immigrants | Switzerland | 99.0 /100 | #83 | Exceptional 11.1% |
| Immigrants | Sierra Leone | 99.0 /100 | #84 | Exceptional 11.1% |
| Immigrants | Belarus | 98.9 /100 | #85 | Exceptional 11.1% |
| Immigrants | Russia | 98.9 /100 | #86 | Exceptional 11.1% |
| Palestinians | 98.9 /100 | #87 | Exceptional 11.1% |
| Immigrants | Romania | 98.5 /100 | #88 | Exceptional 11.2% |
| Immigrants | South Africa | 98.2 /100 | #89 | Exceptional 11.2% |
| Immigrants | Brazil | 98.1 /100 | #90 | Exceptional 11.2% |
| Immigrants | Western Asia | 98.1 /100 | #91 | Exceptional 11.2% |
| Ecuadorians | 98.0 /100 | #92 | Exceptional 11.2% |
| Immigrants | Ecuador | 98.0 /100 | #93 | Exceptional 11.2% |
| Immigrants | Morocco | 97.8 /100 | #94 | Exceptional 11.2% |