Menominee vs Inupiat Unemployment Among Women with Children Under 18 years
COMPARE
Menominee
Inupiat
Unemployment Among Women with Children Under 18 years
Unemployment Among Women with Children Under 18 years Comparison
Menominee
Inupiat
5.6%
UNEMPLOYMENT AMONG WOMEN WITH CHILDREN UNDER 18 YEARS
18.6/ 100
METRIC RATING
200th/ 347
METRIC RANK
9.6%
UNEMPLOYMENT AMONG WOMEN WITH CHILDREN UNDER 18 YEARS
0.0/ 100
METRIC RATING
344th/ 347
METRIC RANK
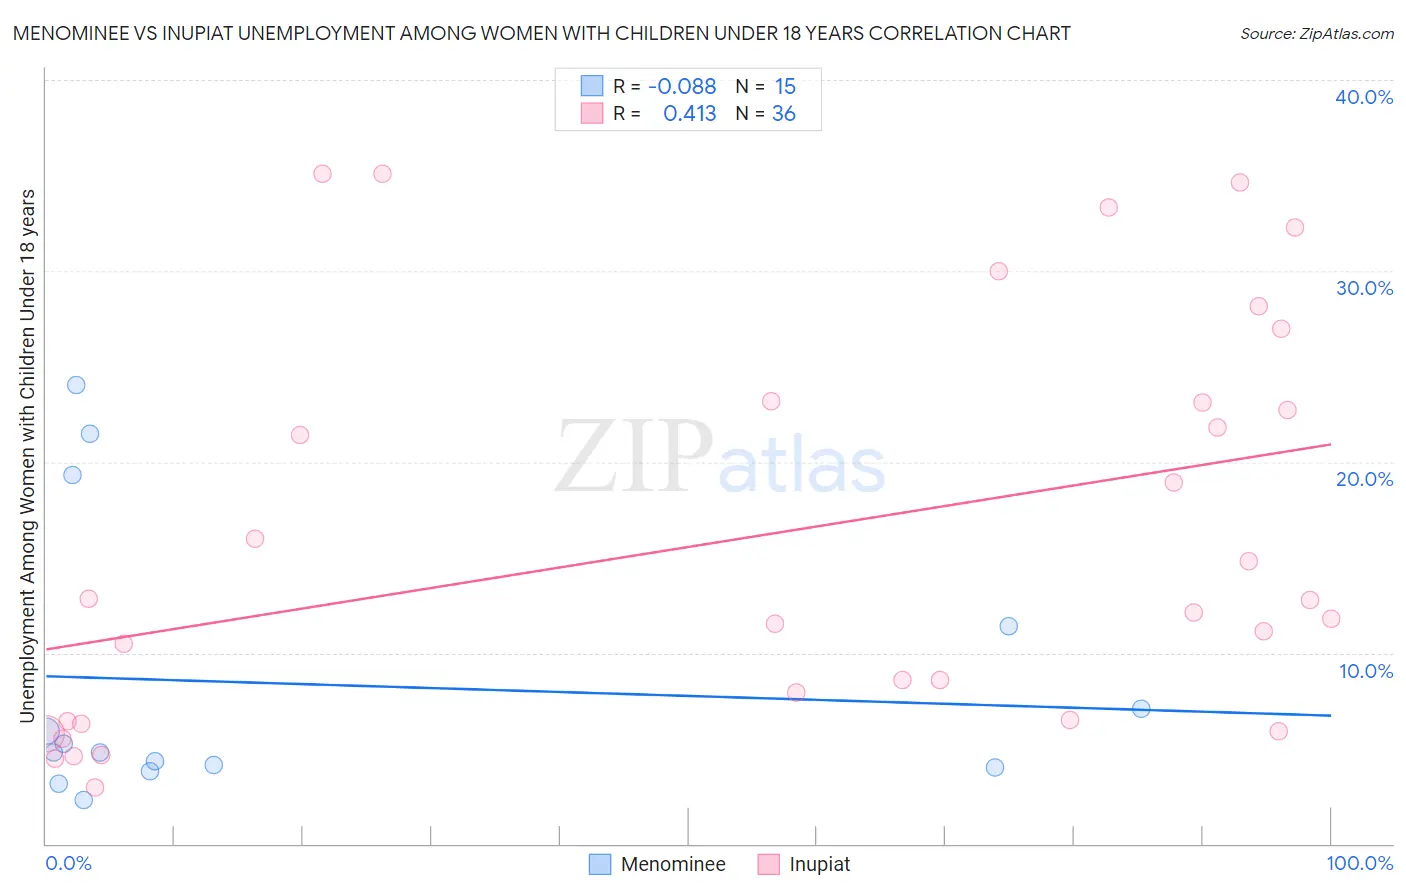
Menominee vs Inupiat Unemployment Among Women with Children Under 18 years Correlation Chart
The statistical analysis conducted on geographies consisting of 45,024,855 people shows a slight negative correlation between the proportion of Menominee and unemployment rate among women with children under the age of 18 in the United States with a correlation coefficient (R) of -0.088 and weighted average of 5.6%. Similarly, the statistical analysis conducted on geographies consisting of 94,720,534 people shows a moderate positive correlation between the proportion of Inupiat and unemployment rate among women with children under the age of 18 in the United States with a correlation coefficient (R) of 0.413 and weighted average of 9.6%, a difference of 71.4%.
Unemployment Among Women with Children Under 18 years Correlation Summary
| Measurement | Menominee | Inupiat |
| Minimum | 2.3% | 2.9% |
| Maximum | 24.0% | 35.1% |
| Range | 21.7% | 32.2% |
| Mean | 8.4% | 16.1% |
| Median | 4.8% | 12.4% |
| Interquartile 25% (IQ1) | 4.0% | 6.5% |
| Interquartile 75% (IQ3) | 11.4% | 23.1% |
| Interquartile Range (IQR) | 7.4% | 16.7% |
| Standard Deviation (Sample) | 7.2% | 10.4% |
| Standard Deviation (Population) | 7.0% | 10.3% |
Similar Demographics by Unemployment Among Women with Children Under 18 years
Demographics Similar to Menominee by Unemployment Among Women with Children Under 18 years
In terms of unemployment among women with children under 18 years, the demographic groups most similar to Menominee are Immigrants from Morocco (5.6%, a difference of 0.080%), Marshallese (5.6%, a difference of 0.18%), Immigrants from Micronesia (5.6%, a difference of 0.18%), Immigrants from Colombia (5.6%, a difference of 0.31%), and Arab (5.6%, a difference of 0.31%).
| Demographics | Rating | Rank | Unemployment Among Women with Children Under 18 years |
| Immigrants | Afghanistan | 29.3 /100 | #193 | Fair 5.5% |
| Immigrants | Chile | 29.2 /100 | #194 | Fair 5.5% |
| Colombians | 22.8 /100 | #195 | Fair 5.6% |
| Spaniards | 22.8 /100 | #196 | Fair 5.6% |
| Immigrants | Colombia | 21.4 /100 | #197 | Fair 5.6% |
| Arabs | 21.4 /100 | #198 | Fair 5.6% |
| Marshallese | 20.2 /100 | #199 | Fair 5.6% |
| Menominee | 18.6 /100 | #200 | Poor 5.6% |
| Immigrants | Morocco | 17.9 /100 | #201 | Poor 5.6% |
| Immigrants | Micronesia | 17.1 /100 | #202 | Poor 5.6% |
| Portuguese | 15.9 /100 | #203 | Poor 5.6% |
| Israelis | 15.6 /100 | #204 | Poor 5.6% |
| Tsimshian | 15.2 /100 | #205 | Poor 5.6% |
| Nicaraguans | 12.3 /100 | #206 | Poor 5.6% |
| Peruvians | 12.1 /100 | #207 | Poor 5.6% |
Demographics Similar to Inupiat by Unemployment Among Women with Children Under 18 years
In terms of unemployment among women with children under 18 years, the demographic groups most similar to Inupiat are Yuman (9.8%, a difference of 1.9%), Arapaho (9.2%, a difference of 4.2%), Puerto Rican (9.0%, a difference of 6.4%), Tohono O'odham (8.9%, a difference of 8.1%), and Yup'ik (11.0%, a difference of 15.1%).
| Demographics | Rating | Rank | Unemployment Among Women with Children Under 18 years |
| Immigrants | Dominican Republic | 0.0 /100 | #333 | Tragic 7.5% |
| Cheyenne | 0.0 /100 | #334 | Tragic 7.8% |
| Apache | 0.0 /100 | #335 | Tragic 7.9% |
| Sioux | 0.0 /100 | #336 | Tragic 7.9% |
| Yakama | 0.0 /100 | #337 | Tragic 8.1% |
| Immigrants | Yemen | 0.0 /100 | #338 | Tragic 8.2% |
| Navajo | 0.0 /100 | #339 | Tragic 8.2% |
| Crow | 0.0 /100 | #340 | Tragic 8.2% |
| Tohono O'odham | 0.0 /100 | #341 | Tragic 8.9% |
| Puerto Ricans | 0.0 /100 | #342 | Tragic 9.0% |
| Arapaho | 0.0 /100 | #343 | Tragic 9.2% |
| Inupiat | 0.0 /100 | #344 | Tragic 9.6% |
| Yuman | 0.0 /100 | #345 | Tragic 9.8% |
| Yup'ik | 0.0 /100 | #346 | Tragic 11.0% |
| Pima | 0.0 /100 | #347 | Tragic 11.7% |