Maltese vs West Indian Female Disability
COMPARE
Maltese
West Indian
Female Disability
Female Disability Comparison
Maltese
West Indians
12.2%
FEMALE DISABILITY
57.0/ 100
METRIC RATING
170th/ 347
METRIC RANK
12.8%
FEMALE DISABILITY
0.5/ 100
METRIC RATING
265th/ 347
METRIC RANK
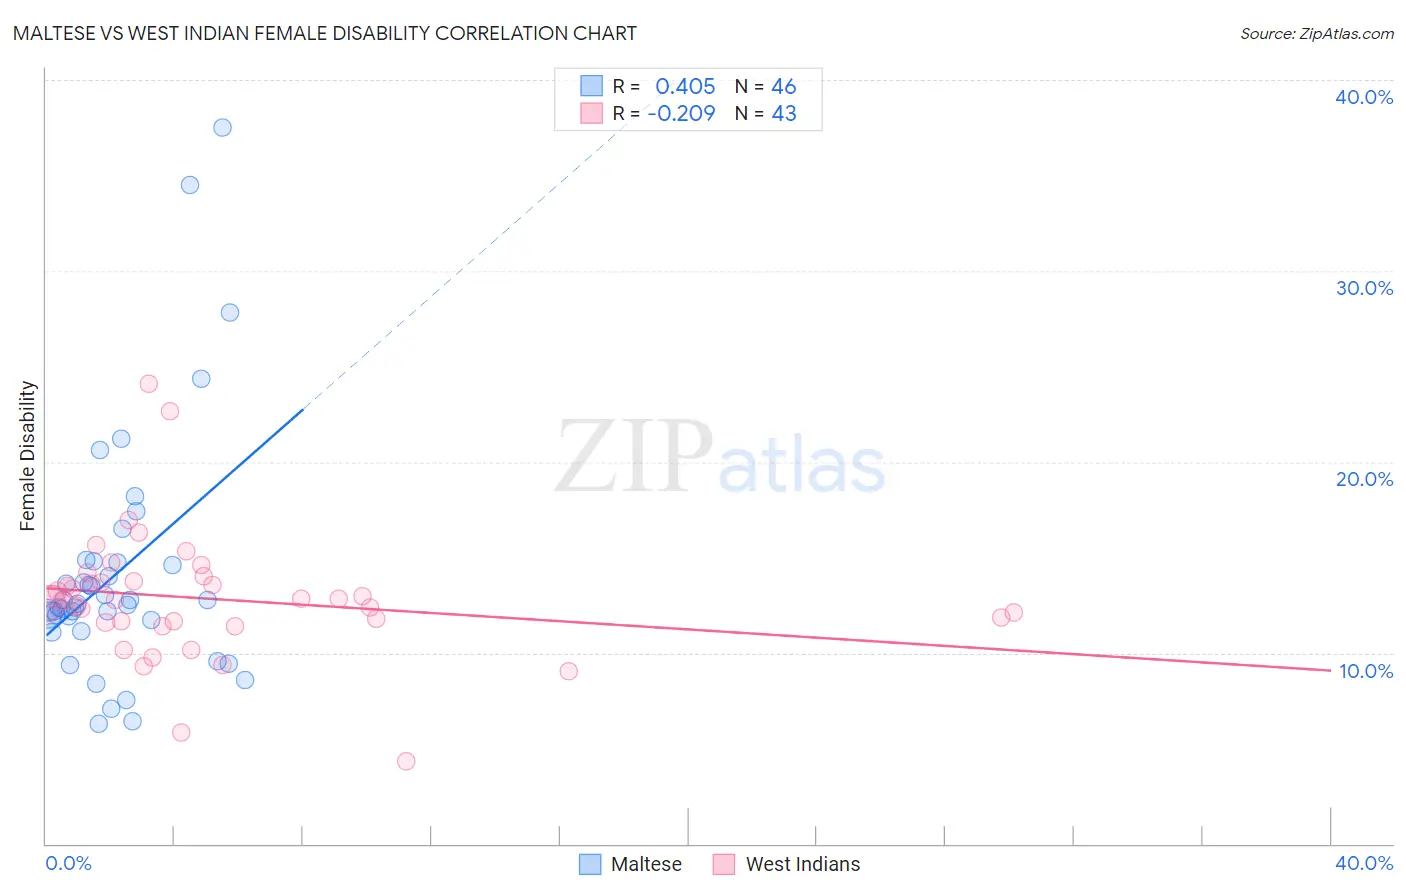
Maltese vs West Indian Female Disability Correlation Chart
The statistical analysis conducted on geographies consisting of 126,465,818 people shows a moderate positive correlation between the proportion of Maltese and percentage of females with a disability in the United States with a correlation coefficient (R) of 0.405 and weighted average of 12.2%. Similarly, the statistical analysis conducted on geographies consisting of 254,014,904 people shows a weak negative correlation between the proportion of West Indians and percentage of females with a disability in the United States with a correlation coefficient (R) of -0.209 and weighted average of 12.8%, a difference of 5.3%.
Female Disability Correlation Summary
| Measurement | Maltese | West Indian |
| Minimum | 6.3% | 4.3% |
| Maximum | 37.5% | 24.1% |
| Range | 31.2% | 19.8% |
| Mean | 14.1% | 12.8% |
| Median | 12.5% | 12.8% |
| Interquartile 25% (IQ1) | 11.7% | 11.6% |
| Interquartile 75% (IQ3) | 14.7% | 13.8% |
| Interquartile Range (IQR) | 3.0% | 2.2% |
| Standard Deviation (Sample) | 6.3% | 3.4% |
| Standard Deviation (Population) | 6.3% | 3.3% |
Similar Demographics by Female Disability
Demographics Similar to Maltese by Female Disability
In terms of female disability, the demographic groups most similar to Maltese are Immigrants from Southern Europe (12.2%, a difference of 0.030%), Lebanese (12.2%, a difference of 0.040%), Immigrants from Haiti (12.2%, a difference of 0.070%), Immigrants from Latin America (12.2%, a difference of 0.080%), and Lithuanian (12.2%, a difference of 0.10%).
| Demographics | Rating | Rank | Female Disability |
| Guatemalans | 63.8 /100 | #163 | Good 12.1% |
| Czechs | 63.6 /100 | #164 | Good 12.1% |
| Immigrants | Oceania | 61.8 /100 | #165 | Good 12.1% |
| Lithuanians | 59.5 /100 | #166 | Average 12.2% |
| Immigrants | Latin America | 59.0 /100 | #167 | Average 12.2% |
| Immigrants | Haiti | 58.8 /100 | #168 | Average 12.2% |
| Lebanese | 58.1 /100 | #169 | Average 12.2% |
| Maltese | 57.0 /100 | #170 | Average 12.2% |
| Immigrants | Southern Europe | 56.3 /100 | #171 | Average 12.2% |
| Haitians | 51.9 /100 | #172 | Average 12.2% |
| Immigrants | Mexico | 50.8 /100 | #173 | Average 12.2% |
| Immigrants | England | 50.0 /100 | #174 | Average 12.2% |
| Immigrants | St. Vincent and the Grenadines | 49.7 /100 | #175 | Average 12.2% |
| Immigrants | Guyana | 43.1 /100 | #176 | Average 12.2% |
| Immigrants | Ghana | 42.5 /100 | #177 | Average 12.2% |
Demographics Similar to West Indians by Female Disability
In terms of female disability, the demographic groups most similar to West Indians are Finnish (12.8%, a difference of 0.12%), Senegalese (12.8%, a difference of 0.13%), Immigrants from Laos (12.8%, a difference of 0.16%), Alaska Native (12.8%, a difference of 0.19%), and Indonesian (12.8%, a difference of 0.22%).
| Demographics | Rating | Rank | Female Disability |
| Aleuts | 1.1 /100 | #258 | Tragic 12.7% |
| Immigrants | Armenia | 1.0 /100 | #259 | Tragic 12.7% |
| Sub-Saharan Africans | 1.0 /100 | #260 | Tragic 12.7% |
| Bermudans | 1.0 /100 | #261 | Tragic 12.7% |
| Czechoslovakians | 0.9 /100 | #262 | Tragic 12.7% |
| Spaniards | 0.7 /100 | #263 | Tragic 12.8% |
| Alaska Natives | 0.6 /100 | #264 | Tragic 12.8% |
| West Indians | 0.5 /100 | #265 | Tragic 12.8% |
| Finns | 0.4 /100 | #266 | Tragic 12.8% |
| Senegalese | 0.4 /100 | #267 | Tragic 12.8% |
| Immigrants | Laos | 0.4 /100 | #268 | Tragic 12.8% |
| Indonesians | 0.4 /100 | #269 | Tragic 12.8% |
| Immigrants | Liberia | 0.3 /100 | #270 | Tragic 12.9% |
| Dutch | 0.2 /100 | #271 | Tragic 12.9% |
| Germans | 0.1 /100 | #272 | Tragic 12.9% |