Maltese vs Hungarian Cognitive Disability
COMPARE
Maltese
Hungarian
Cognitive Disability
Cognitive Disability Comparison
Maltese
Hungarians
16.2%
COGNITIVE DISABILITY
100.0/ 100
METRIC RATING
12th/ 347
METRIC RANK
16.5%
COGNITIVE DISABILITY
99.9/ 100
METRIC RATING
42nd/ 347
METRIC RANK
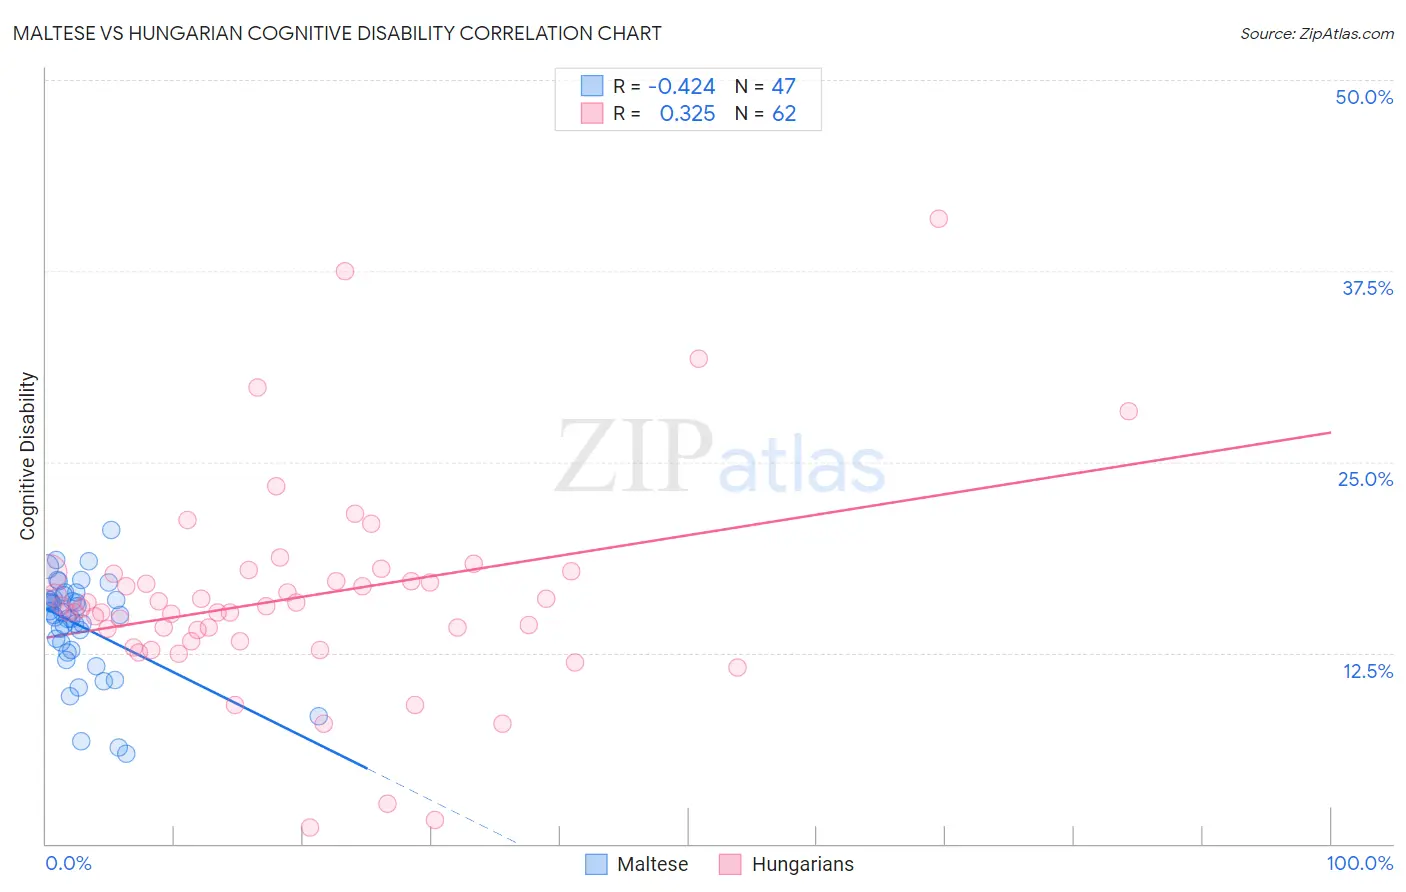
Maltese vs Hungarian Cognitive Disability Correlation Chart
The statistical analysis conducted on geographies consisting of 126,468,065 people shows a moderate negative correlation between the proportion of Maltese and percentage of population with cognitive disability in the United States with a correlation coefficient (R) of -0.424 and weighted average of 16.2%. Similarly, the statistical analysis conducted on geographies consisting of 486,167,723 people shows a mild positive correlation between the proportion of Hungarians and percentage of population with cognitive disability in the United States with a correlation coefficient (R) of 0.325 and weighted average of 16.5%, a difference of 1.4%.
Cognitive Disability Correlation Summary
| Measurement | Maltese | Hungarian |
| Minimum | 5.9% | 1.0% |
| Maximum | 20.5% | 40.9% |
| Range | 14.6% | 39.9% |
| Mean | 14.3% | 16.1% |
| Median | 15.0% | 15.5% |
| Interquartile 25% (IQ1) | 12.7% | 13.3% |
| Interquartile 75% (IQ3) | 16.1% | 17.7% |
| Interquartile Range (IQR) | 3.4% | 4.4% |
| Standard Deviation (Sample) | 3.2% | 6.8% |
| Standard Deviation (Population) | 3.2% | 6.7% |
Similar Demographics by Cognitive Disability
Demographics Similar to Maltese by Cognitive Disability
In terms of cognitive disability, the demographic groups most similar to Maltese are Lithuanian (16.3%, a difference of 0.090%), Immigrants from Austria (16.3%, a difference of 0.15%), Immigrants from Czechoslovakia (16.2%, a difference of 0.16%), Immigrants from Greece (16.3%, a difference of 0.18%), and Immigrants from Scotland (16.2%, a difference of 0.25%).
| Demographics | Rating | Rank | Cognitive Disability |
| Immigrants | Hong Kong | 100.0 /100 | #5 | Exceptional 16.0% |
| Thais | 100.0 /100 | #6 | Exceptional 16.1% |
| Immigrants | Ireland | 100.0 /100 | #7 | Exceptional 16.1% |
| Immigrants | Poland | 100.0 /100 | #8 | Exceptional 16.1% |
| Assyrians/Chaldeans/Syriacs | 100.0 /100 | #9 | Exceptional 16.2% |
| Immigrants | Scotland | 100.0 /100 | #10 | Exceptional 16.2% |
| Immigrants | Czechoslovakia | 100.0 /100 | #11 | Exceptional 16.2% |
| Maltese | 100.0 /100 | #12 | Exceptional 16.2% |
| Lithuanians | 100.0 /100 | #13 | Exceptional 16.3% |
| Immigrants | Austria | 100.0 /100 | #14 | Exceptional 16.3% |
| Immigrants | Greece | 100.0 /100 | #15 | Exceptional 16.3% |
| Eastern Europeans | 100.0 /100 | #16 | Exceptional 16.3% |
| Immigrants | North Macedonia | 100.0 /100 | #17 | Exceptional 16.3% |
| Immigrants | Northern Europe | 100.0 /100 | #18 | Exceptional 16.3% |
| Immigrants | Bolivia | 100.0 /100 | #19 | Exceptional 16.3% |
Demographics Similar to Hungarians by Cognitive Disability
In terms of cognitive disability, the demographic groups most similar to Hungarians are Cuban (16.5%, a difference of 0.010%), Immigrants from Belarus (16.5%, a difference of 0.020%), Bolivian (16.5%, a difference of 0.030%), Immigrants from Canada (16.5%, a difference of 0.060%), and Macedonian (16.5%, a difference of 0.090%).
| Demographics | Rating | Rank | Cognitive Disability |
| Slovaks | 99.9 /100 | #35 | Exceptional 16.4% |
| Greeks | 99.9 /100 | #36 | Exceptional 16.4% |
| Slovenes | 99.9 /100 | #37 | Exceptional 16.5% |
| Immigrants | Eastern Europe | 99.9 /100 | #38 | Exceptional 16.5% |
| Bolivians | 99.9 /100 | #39 | Exceptional 16.5% |
| Immigrants | Belarus | 99.9 /100 | #40 | Exceptional 16.5% |
| Cubans | 99.9 /100 | #41 | Exceptional 16.5% |
| Hungarians | 99.9 /100 | #42 | Exceptional 16.5% |
| Immigrants | Canada | 99.8 /100 | #43 | Exceptional 16.5% |
| Macedonians | 99.8 /100 | #44 | Exceptional 16.5% |
| Immigrants | Europe | 99.8 /100 | #45 | Exceptional 16.5% |
| Immigrants | Colombia | 99.8 /100 | #46 | Exceptional 16.5% |
| Immigrants | Italy | 99.8 /100 | #47 | Exceptional 16.5% |
| Immigrants | North America | 99.8 /100 | #48 | Exceptional 16.5% |
| Iranians | 99.8 /100 | #49 | Exceptional 16.5% |