Immigrants from Bolivia vs Hungarian Cognitive Disability
COMPARE
Immigrants from Bolivia
Hungarian
Cognitive Disability
Cognitive Disability Comparison
Immigrants from Bolivia
Hungarians
16.3%
COGNITIVE DISABILITY
100.0/ 100
METRIC RATING
19th/ 347
METRIC RANK
16.5%
COGNITIVE DISABILITY
99.9/ 100
METRIC RATING
42nd/ 347
METRIC RANK
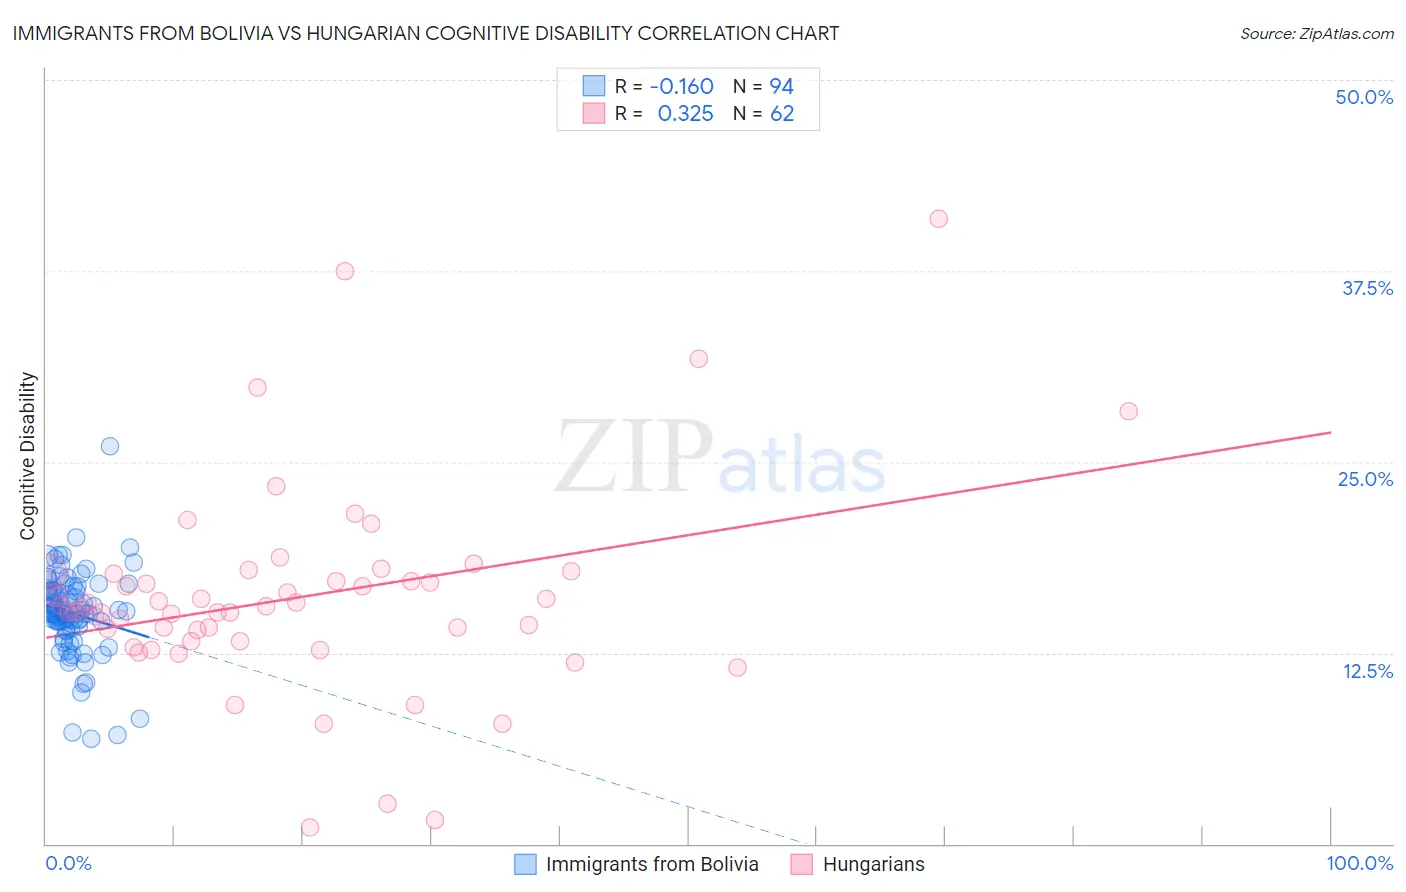
Immigrants from Bolivia vs Hungarian Cognitive Disability Correlation Chart
The statistical analysis conducted on geographies consisting of 158,730,419 people shows a poor negative correlation between the proportion of Immigrants from Bolivia and percentage of population with cognitive disability in the United States with a correlation coefficient (R) of -0.160 and weighted average of 16.3%. Similarly, the statistical analysis conducted on geographies consisting of 486,167,723 people shows a mild positive correlation between the proportion of Hungarians and percentage of population with cognitive disability in the United States with a correlation coefficient (R) of 0.325 and weighted average of 16.5%, a difference of 0.88%.
Cognitive Disability Correlation Summary
| Measurement | Immigrants from Bolivia | Hungarian |
| Minimum | 6.8% | 1.0% |
| Maximum | 26.0% | 40.9% |
| Range | 19.2% | 39.9% |
| Mean | 15.1% | 16.1% |
| Median | 15.1% | 15.5% |
| Interquartile 25% (IQ1) | 14.2% | 13.3% |
| Interquartile 75% (IQ3) | 16.5% | 17.7% |
| Interquartile Range (IQR) | 2.3% | 4.4% |
| Standard Deviation (Sample) | 2.8% | 6.8% |
| Standard Deviation (Population) | 2.8% | 6.7% |
Similar Demographics by Cognitive Disability
Demographics Similar to Immigrants from Bolivia by Cognitive Disability
In terms of cognitive disability, the demographic groups most similar to Immigrants from Bolivia are Immigrants from Northern Europe (16.3%, a difference of 0.0%), Bulgarian (16.3%, a difference of 0.010%), Immigrants from Cuba (16.3%, a difference of 0.060%), Immigrants from North Macedonia (16.3%, a difference of 0.070%), and Eastern European (16.3%, a difference of 0.090%).
| Demographics | Rating | Rank | Cognitive Disability |
| Maltese | 100.0 /100 | #12 | Exceptional 16.2% |
| Lithuanians | 100.0 /100 | #13 | Exceptional 16.3% |
| Immigrants | Austria | 100.0 /100 | #14 | Exceptional 16.3% |
| Immigrants | Greece | 100.0 /100 | #15 | Exceptional 16.3% |
| Eastern Europeans | 100.0 /100 | #16 | Exceptional 16.3% |
| Immigrants | North Macedonia | 100.0 /100 | #17 | Exceptional 16.3% |
| Immigrants | Northern Europe | 100.0 /100 | #18 | Exceptional 16.3% |
| Immigrants | Bolivia | 100.0 /100 | #19 | Exceptional 16.3% |
| Bulgarians | 100.0 /100 | #20 | Exceptional 16.3% |
| Immigrants | Cuba | 100.0 /100 | #21 | Exceptional 16.3% |
| Immigrants | South Central Asia | 99.9 /100 | #22 | Exceptional 16.4% |
| Croatians | 99.9 /100 | #23 | Exceptional 16.4% |
| Immigrants | Argentina | 99.9 /100 | #24 | Exceptional 16.4% |
| Luxembourgers | 99.9 /100 | #25 | Exceptional 16.4% |
| Immigrants | Croatia | 99.9 /100 | #26 | Exceptional 16.4% |
Demographics Similar to Hungarians by Cognitive Disability
In terms of cognitive disability, the demographic groups most similar to Hungarians are Cuban (16.5%, a difference of 0.010%), Immigrants from Belarus (16.5%, a difference of 0.020%), Bolivian (16.5%, a difference of 0.030%), Immigrants from Canada (16.5%, a difference of 0.060%), and Macedonian (16.5%, a difference of 0.090%).
| Demographics | Rating | Rank | Cognitive Disability |
| Slovaks | 99.9 /100 | #35 | Exceptional 16.4% |
| Greeks | 99.9 /100 | #36 | Exceptional 16.4% |
| Slovenes | 99.9 /100 | #37 | Exceptional 16.5% |
| Immigrants | Eastern Europe | 99.9 /100 | #38 | Exceptional 16.5% |
| Bolivians | 99.9 /100 | #39 | Exceptional 16.5% |
| Immigrants | Belarus | 99.9 /100 | #40 | Exceptional 16.5% |
| Cubans | 99.9 /100 | #41 | Exceptional 16.5% |
| Hungarians | 99.9 /100 | #42 | Exceptional 16.5% |
| Immigrants | Canada | 99.8 /100 | #43 | Exceptional 16.5% |
| Macedonians | 99.8 /100 | #44 | Exceptional 16.5% |
| Immigrants | Europe | 99.8 /100 | #45 | Exceptional 16.5% |
| Immigrants | Colombia | 99.8 /100 | #46 | Exceptional 16.5% |
| Immigrants | Italy | 99.8 /100 | #47 | Exceptional 16.5% |
| Immigrants | North America | 99.8 /100 | #48 | Exceptional 16.5% |
| Iranians | 99.8 /100 | #49 | Exceptional 16.5% |