Immigrants from Dominica vs Hungarian Cognitive Disability
COMPARE
Immigrants from Dominica
Hungarian
Cognitive Disability
Cognitive Disability Comparison
Immigrants from Dominica
Hungarians
18.6%
COGNITIVE DISABILITY
0.0/ 100
METRIC RATING
315th/ 347
METRIC RANK
16.5%
COGNITIVE DISABILITY
99.9/ 100
METRIC RATING
42nd/ 347
METRIC RANK
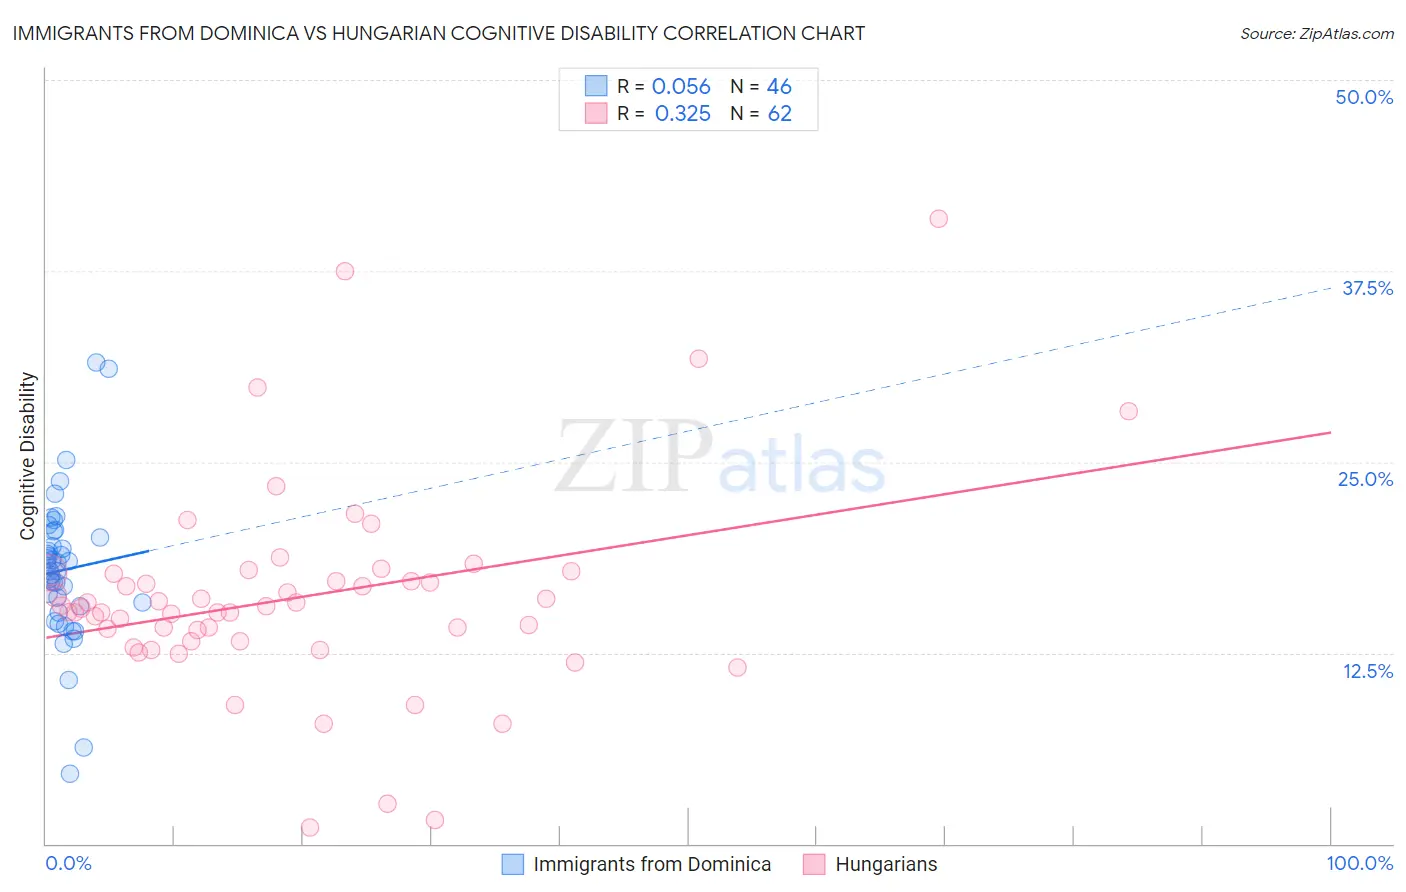
Immigrants from Dominica vs Hungarian Cognitive Disability Correlation Chart
The statistical analysis conducted on geographies consisting of 83,793,635 people shows a slight positive correlation between the proportion of Immigrants from Dominica and percentage of population with cognitive disability in the United States with a correlation coefficient (R) of 0.056 and weighted average of 18.6%. Similarly, the statistical analysis conducted on geographies consisting of 486,167,723 people shows a mild positive correlation between the proportion of Hungarians and percentage of population with cognitive disability in the United States with a correlation coefficient (R) of 0.325 and weighted average of 16.5%, a difference of 12.7%.
Cognitive Disability Correlation Summary
| Measurement | Immigrants from Dominica | Hungarian |
| Minimum | 4.6% | 1.0% |
| Maximum | 31.5% | 40.9% |
| Range | 27.0% | 39.9% |
| Mean | 17.9% | 16.1% |
| Median | 18.0% | 15.5% |
| Interquartile 25% (IQ1) | 15.6% | 13.3% |
| Interquartile 75% (IQ3) | 20.0% | 17.7% |
| Interquartile Range (IQR) | 4.5% | 4.4% |
| Standard Deviation (Sample) | 4.8% | 6.8% |
| Standard Deviation (Population) | 4.8% | 6.7% |
Similar Demographics by Cognitive Disability
Demographics Similar to Immigrants from Dominica by Cognitive Disability
In terms of cognitive disability, the demographic groups most similar to Immigrants from Dominica are Immigrants from Middle Africa (18.6%, a difference of 0.080%), Liberian (18.6%, a difference of 0.16%), Subsaharan African (18.5%, a difference of 0.18%), Yaqui (18.5%, a difference of 0.24%), and Bangladeshi (18.6%, a difference of 0.28%).
| Demographics | Rating | Rank | Cognitive Disability |
| Immigrants | Western Africa | 0.0 /100 | #308 | Tragic 18.4% |
| Immigrants | Eastern Africa | 0.0 /100 | #309 | Tragic 18.4% |
| Choctaw | 0.0 /100 | #310 | Tragic 18.4% |
| Hmong | 0.0 /100 | #311 | Tragic 18.4% |
| Chickasaw | 0.0 /100 | #312 | Tragic 18.5% |
| Yaqui | 0.0 /100 | #313 | Tragic 18.5% |
| Sub-Saharan Africans | 0.0 /100 | #314 | Tragic 18.5% |
| Immigrants | Dominica | 0.0 /100 | #315 | Tragic 18.6% |
| Immigrants | Middle Africa | 0.0 /100 | #316 | Tragic 18.6% |
| Liberians | 0.0 /100 | #317 | Tragic 18.6% |
| Bangladeshis | 0.0 /100 | #318 | Tragic 18.6% |
| Comanche | 0.0 /100 | #319 | Tragic 18.6% |
| Apache | 0.0 /100 | #320 | Tragic 18.6% |
| Africans | 0.0 /100 | #321 | Tragic 18.6% |
| Immigrants | Liberia | 0.0 /100 | #322 | Tragic 18.7% |
Demographics Similar to Hungarians by Cognitive Disability
In terms of cognitive disability, the demographic groups most similar to Hungarians are Cuban (16.5%, a difference of 0.010%), Immigrants from Belarus (16.5%, a difference of 0.020%), Bolivian (16.5%, a difference of 0.030%), Immigrants from Canada (16.5%, a difference of 0.060%), and Macedonian (16.5%, a difference of 0.090%).
| Demographics | Rating | Rank | Cognitive Disability |
| Slovaks | 99.9 /100 | #35 | Exceptional 16.4% |
| Greeks | 99.9 /100 | #36 | Exceptional 16.4% |
| Slovenes | 99.9 /100 | #37 | Exceptional 16.5% |
| Immigrants | Eastern Europe | 99.9 /100 | #38 | Exceptional 16.5% |
| Bolivians | 99.9 /100 | #39 | Exceptional 16.5% |
| Immigrants | Belarus | 99.9 /100 | #40 | Exceptional 16.5% |
| Cubans | 99.9 /100 | #41 | Exceptional 16.5% |
| Hungarians | 99.9 /100 | #42 | Exceptional 16.5% |
| Immigrants | Canada | 99.8 /100 | #43 | Exceptional 16.5% |
| Macedonians | 99.8 /100 | #44 | Exceptional 16.5% |
| Immigrants | Europe | 99.8 /100 | #45 | Exceptional 16.5% |
| Immigrants | Colombia | 99.8 /100 | #46 | Exceptional 16.5% |
| Immigrants | Italy | 99.8 /100 | #47 | Exceptional 16.5% |
| Immigrants | North America | 99.8 /100 | #48 | Exceptional 16.5% |
| Iranians | 99.8 /100 | #49 | Exceptional 16.5% |