Immigrants from Yemen vs Hungarian Cognitive Disability
COMPARE
Immigrants from Yemen
Hungarian
Cognitive Disability
Cognitive Disability Comparison
Immigrants from Yemen
Hungarians
18.8%
COGNITIVE DISABILITY
0.0/ 100
METRIC RATING
333rd/ 347
METRIC RANK
16.5%
COGNITIVE DISABILITY
99.9/ 100
METRIC RATING
42nd/ 347
METRIC RANK
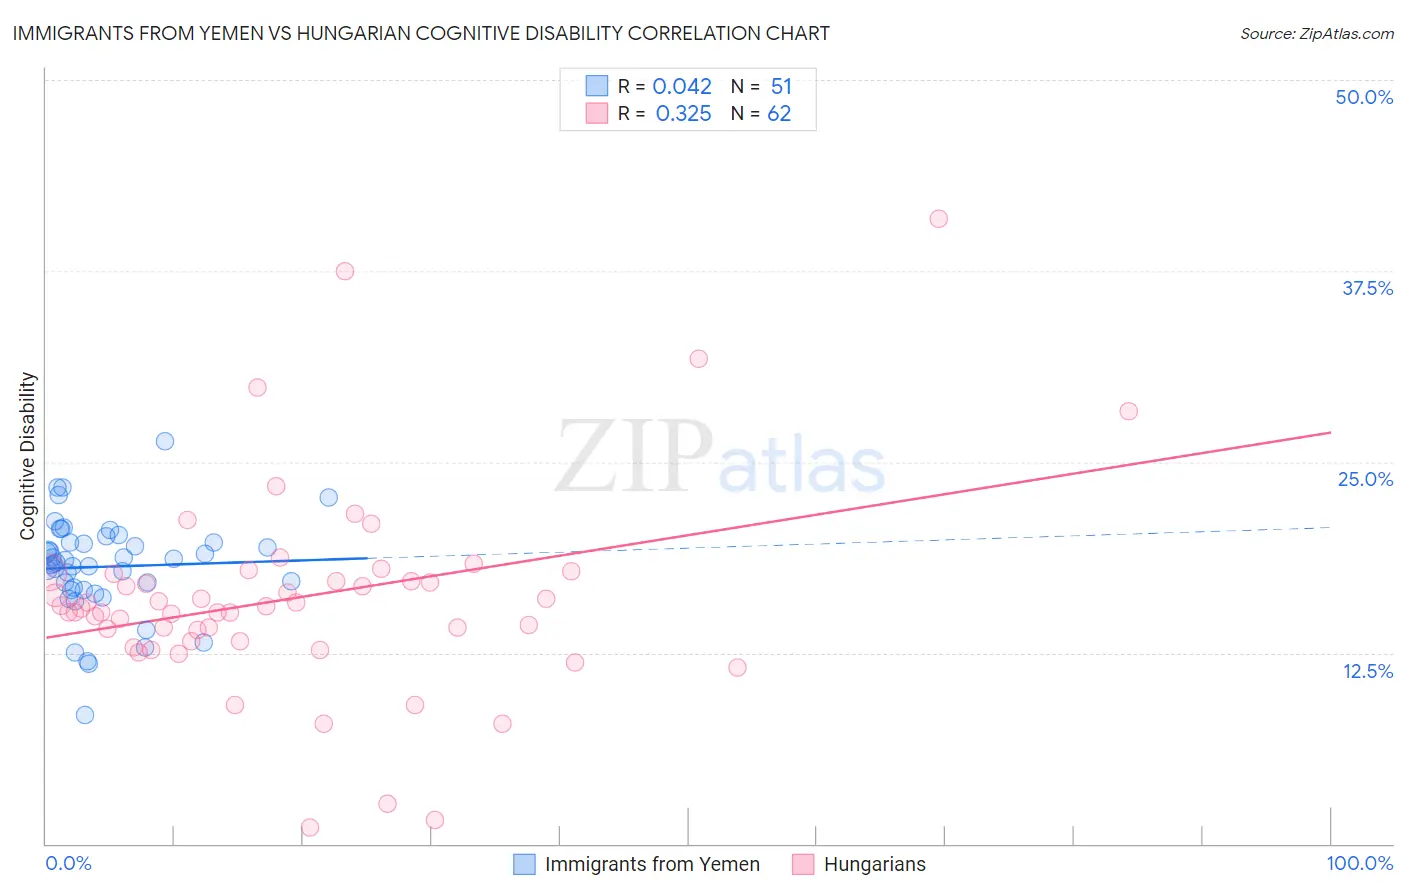
Immigrants from Yemen vs Hungarian Cognitive Disability Correlation Chart
The statistical analysis conducted on geographies consisting of 82,433,611 people shows no correlation between the proportion of Immigrants from Yemen and percentage of population with cognitive disability in the United States with a correlation coefficient (R) of 0.042 and weighted average of 18.8%. Similarly, the statistical analysis conducted on geographies consisting of 486,167,723 people shows a mild positive correlation between the proportion of Hungarians and percentage of population with cognitive disability in the United States with a correlation coefficient (R) of 0.325 and weighted average of 16.5%, a difference of 14.1%.
Cognitive Disability Correlation Summary
| Measurement | Immigrants from Yemen | Hungarian |
| Minimum | 8.4% | 1.0% |
| Maximum | 26.3% | 40.9% |
| Range | 17.9% | 39.9% |
| Mean | 18.1% | 16.1% |
| Median | 18.4% | 15.5% |
| Interquartile 25% (IQ1) | 16.6% | 13.3% |
| Interquartile 75% (IQ3) | 19.7% | 17.7% |
| Interquartile Range (IQR) | 3.1% | 4.4% |
| Standard Deviation (Sample) | 3.2% | 6.8% |
| Standard Deviation (Population) | 3.2% | 6.7% |
Similar Demographics by Cognitive Disability
Demographics Similar to Immigrants from Yemen by Cognitive Disability
In terms of cognitive disability, the demographic groups most similar to Immigrants from Yemen are Immigrants from Sudan (18.8%, a difference of 0.060%), Pima (18.8%, a difference of 0.070%), Immigrants from Dominican Republic (18.8%, a difference of 0.14%), Navajo (18.8%, a difference of 0.24%), and Sudanese (18.9%, a difference of 0.38%).
| Demographics | Rating | Rank | Cognitive Disability |
| Immigrants | Senegal | 0.0 /100 | #326 | Tragic 18.7% |
| U.S. Virgin Islanders | 0.0 /100 | #327 | Tragic 18.7% |
| Kiowa | 0.0 /100 | #328 | Tragic 18.7% |
| Navajo | 0.0 /100 | #329 | Tragic 18.8% |
| Immigrants | Dominican Republic | 0.0 /100 | #330 | Tragic 18.8% |
| Pima | 0.0 /100 | #331 | Tragic 18.8% |
| Immigrants | Sudan | 0.0 /100 | #332 | Tragic 18.8% |
| Immigrants | Yemen | 0.0 /100 | #333 | Tragic 18.8% |
| Sudanese | 0.0 /100 | #334 | Tragic 18.9% |
| Senegalese | 0.0 /100 | #335 | Tragic 19.0% |
| Blacks/African Americans | 0.0 /100 | #336 | Tragic 19.0% |
| Immigrants | Saudi Arabia | 0.0 /100 | #337 | Tragic 19.1% |
| Lumbee | 0.0 /100 | #338 | Tragic 19.1% |
| Puerto Ricans | 0.0 /100 | #339 | Tragic 19.2% |
| Cape Verdeans | 0.0 /100 | #340 | Tragic 19.2% |
Demographics Similar to Hungarians by Cognitive Disability
In terms of cognitive disability, the demographic groups most similar to Hungarians are Cuban (16.5%, a difference of 0.010%), Immigrants from Belarus (16.5%, a difference of 0.020%), Bolivian (16.5%, a difference of 0.030%), Immigrants from Canada (16.5%, a difference of 0.060%), and Macedonian (16.5%, a difference of 0.090%).
| Demographics | Rating | Rank | Cognitive Disability |
| Slovaks | 99.9 /100 | #35 | Exceptional 16.4% |
| Greeks | 99.9 /100 | #36 | Exceptional 16.4% |
| Slovenes | 99.9 /100 | #37 | Exceptional 16.5% |
| Immigrants | Eastern Europe | 99.9 /100 | #38 | Exceptional 16.5% |
| Bolivians | 99.9 /100 | #39 | Exceptional 16.5% |
| Immigrants | Belarus | 99.9 /100 | #40 | Exceptional 16.5% |
| Cubans | 99.9 /100 | #41 | Exceptional 16.5% |
| Hungarians | 99.9 /100 | #42 | Exceptional 16.5% |
| Immigrants | Canada | 99.8 /100 | #43 | Exceptional 16.5% |
| Macedonians | 99.8 /100 | #44 | Exceptional 16.5% |
| Immigrants | Europe | 99.8 /100 | #45 | Exceptional 16.5% |
| Immigrants | Colombia | 99.8 /100 | #46 | Exceptional 16.5% |
| Immigrants | Italy | 99.8 /100 | #47 | Exceptional 16.5% |
| Immigrants | North America | 99.8 /100 | #48 | Exceptional 16.5% |
| Iranians | 99.8 /100 | #49 | Exceptional 16.5% |