Colombian vs Immigrants from Norway Female Disability
COMPARE
Colombian
Immigrants from Norway
Female Disability
Female Disability Comparison
Colombians
Immigrants from Norway
11.5%
FEMALE DISABILITY
99.8/ 100
METRIC RATING
69th/ 347
METRIC RANK
11.9%
FEMALE DISABILITY
93.8/ 100
METRIC RATING
137th/ 347
METRIC RANK
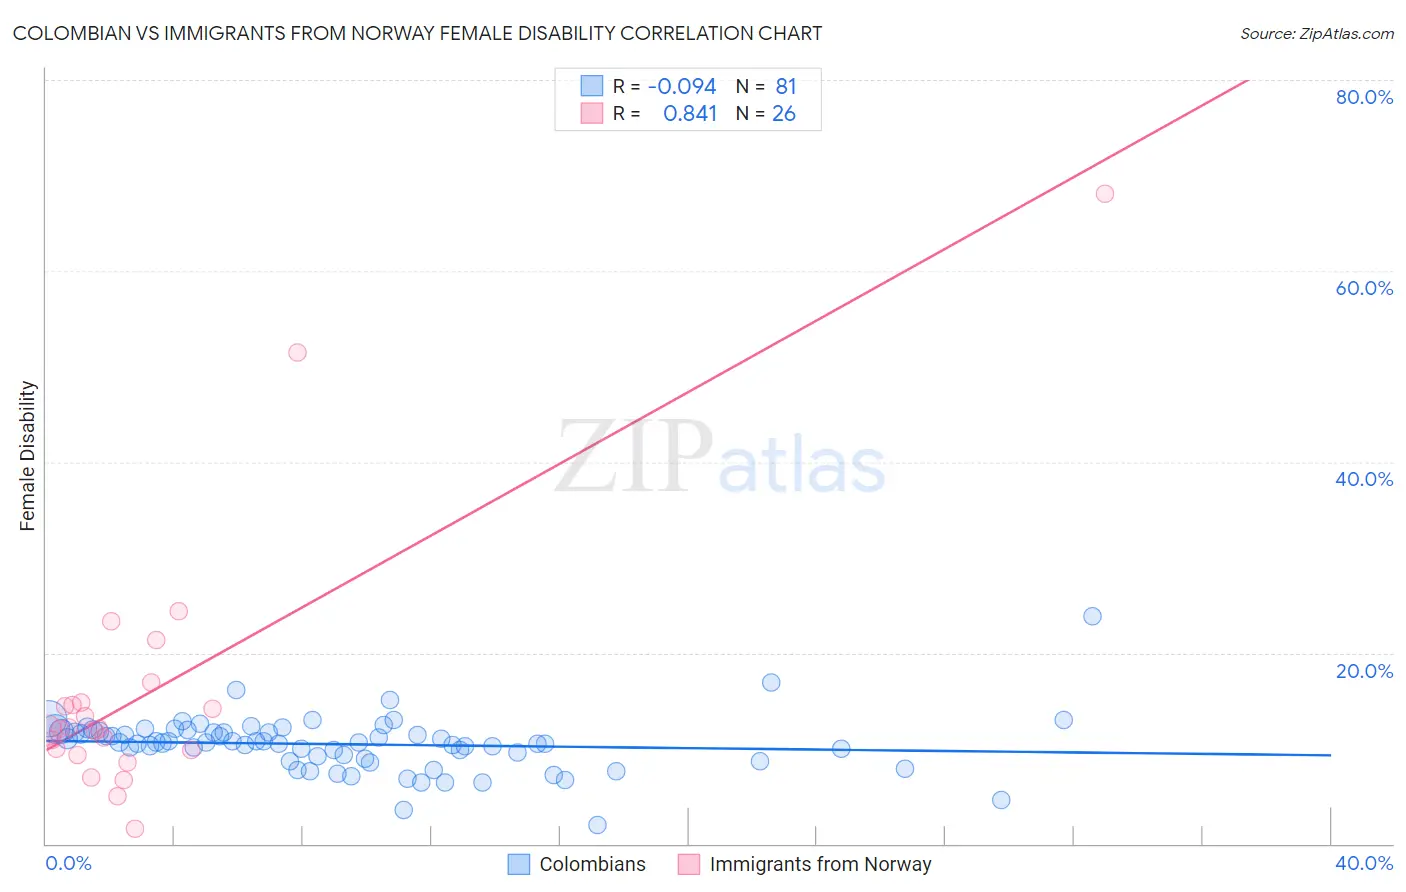
Colombian vs Immigrants from Norway Female Disability Correlation Chart
The statistical analysis conducted on geographies consisting of 419,587,687 people shows a slight negative correlation between the proportion of Colombians and percentage of females with a disability in the United States with a correlation coefficient (R) of -0.094 and weighted average of 11.5%. Similarly, the statistical analysis conducted on geographies consisting of 116,702,841 people shows a very strong positive correlation between the proportion of Immigrants from Norway and percentage of females with a disability in the United States with a correlation coefficient (R) of 0.841 and weighted average of 11.9%, a difference of 3.6%.
Female Disability Correlation Summary
| Measurement | Colombian | Immigrants from Norway |
| Minimum | 1.9% | 1.5% |
| Maximum | 23.8% | 68.1% |
| Range | 21.9% | 66.6% |
| Mean | 10.4% | 16.0% |
| Median | 10.6% | 12.0% |
| Interquartile 25% (IQ1) | 9.0% | 9.8% |
| Interquartile 75% (IQ3) | 11.7% | 14.8% |
| Interquartile Range (IQR) | 2.7% | 5.0% |
| Standard Deviation (Sample) | 2.9% | 14.1% |
| Standard Deviation (Population) | 2.9% | 13.8% |
Similar Demographics by Female Disability
Demographics Similar to Colombians by Female Disability
In terms of female disability, the demographic groups most similar to Colombians are Immigrants from Chile (11.5%, a difference of 0.010%), Immigrants from Ireland (11.5%, a difference of 0.050%), Immigrants from Northern Africa (11.5%, a difference of 0.070%), Immigrants from Vietnam (11.5%, a difference of 0.090%), and Chilean (11.5%, a difference of 0.12%).
| Demographics | Rating | Rank | Female Disability |
| Sri Lankans | 99.9 /100 | #62 | Exceptional 11.4% |
| Immigrants | Colombia | 99.9 /100 | #63 | Exceptional 11.4% |
| Immigrants | El Salvador | 99.9 /100 | #64 | Exceptional 11.4% |
| Immigrants | South America | 99.9 /100 | #65 | Exceptional 11.4% |
| Salvadorans | 99.8 /100 | #66 | Exceptional 11.5% |
| Immigrants | Vietnam | 99.8 /100 | #67 | Exceptional 11.5% |
| Immigrants | Northern Africa | 99.8 /100 | #68 | Exceptional 11.5% |
| Colombians | 99.8 /100 | #69 | Exceptional 11.5% |
| Immigrants | Chile | 99.8 /100 | #70 | Exceptional 11.5% |
| Immigrants | Ireland | 99.8 /100 | #71 | Exceptional 11.5% |
| Chileans | 99.8 /100 | #72 | Exceptional 11.5% |
| Immigrants | Switzerland | 99.8 /100 | #73 | Exceptional 11.5% |
| Bhutanese | 99.8 /100 | #74 | Exceptional 11.5% |
| Immigrants | Lebanon | 99.7 /100 | #75 | Exceptional 11.5% |
| Immigrants | Eritrea | 99.7 /100 | #76 | Exceptional 11.5% |
Demographics Similar to Immigrants from Norway by Female Disability
In terms of female disability, the demographic groups most similar to Immigrants from Norway are Ugandan (11.9%, a difference of 0.040%), Central American (11.9%, a difference of 0.060%), Ecuadorian (11.9%, a difference of 0.060%), Kenyan (11.9%, a difference of 0.13%), and Immigrants from Nicaragua (11.9%, a difference of 0.13%).
| Demographics | Rating | Rank | Female Disability |
| Nicaraguans | 95.2 /100 | #130 | Exceptional 11.9% |
| Arabs | 95.1 /100 | #131 | Exceptional 11.9% |
| Immigrants | Syria | 94.6 /100 | #132 | Exceptional 11.9% |
| Kenyans | 94.5 /100 | #133 | Exceptional 11.9% |
| Immigrants | Nicaragua | 94.5 /100 | #134 | Exceptional 11.9% |
| Central Americans | 94.2 /100 | #135 | Exceptional 11.9% |
| Ugandans | 94.0 /100 | #136 | Exceptional 11.9% |
| Immigrants | Norway | 93.8 /100 | #137 | Exceptional 11.9% |
| Ecuadorians | 93.4 /100 | #138 | Exceptional 11.9% |
| Immigrants | Hungary | 92.8 /100 | #139 | Exceptional 11.9% |
| Romanians | 91.6 /100 | #140 | Exceptional 11.9% |
| Immigrants | Ecuador | 91.5 /100 | #141 | Exceptional 11.9% |
| Immigrants | Africa | 90.0 /100 | #142 | Excellent 11.9% |
| Immigrants | Sudan | 89.6 /100 | #143 | Excellent 11.9% |
| Immigrants | Austria | 87.9 /100 | #144 | Excellent 12.0% |