Liberian vs Immigrants from Norway Female Disability
COMPARE
Liberian
Immigrants from Norway
Female Disability
Female Disability Comparison
Liberians
Immigrants from Norway
12.7%
FEMALE DISABILITY
1.1/ 100
METRIC RATING
257th/ 347
METRIC RANK
11.9%
FEMALE DISABILITY
93.8/ 100
METRIC RATING
137th/ 347
METRIC RANK
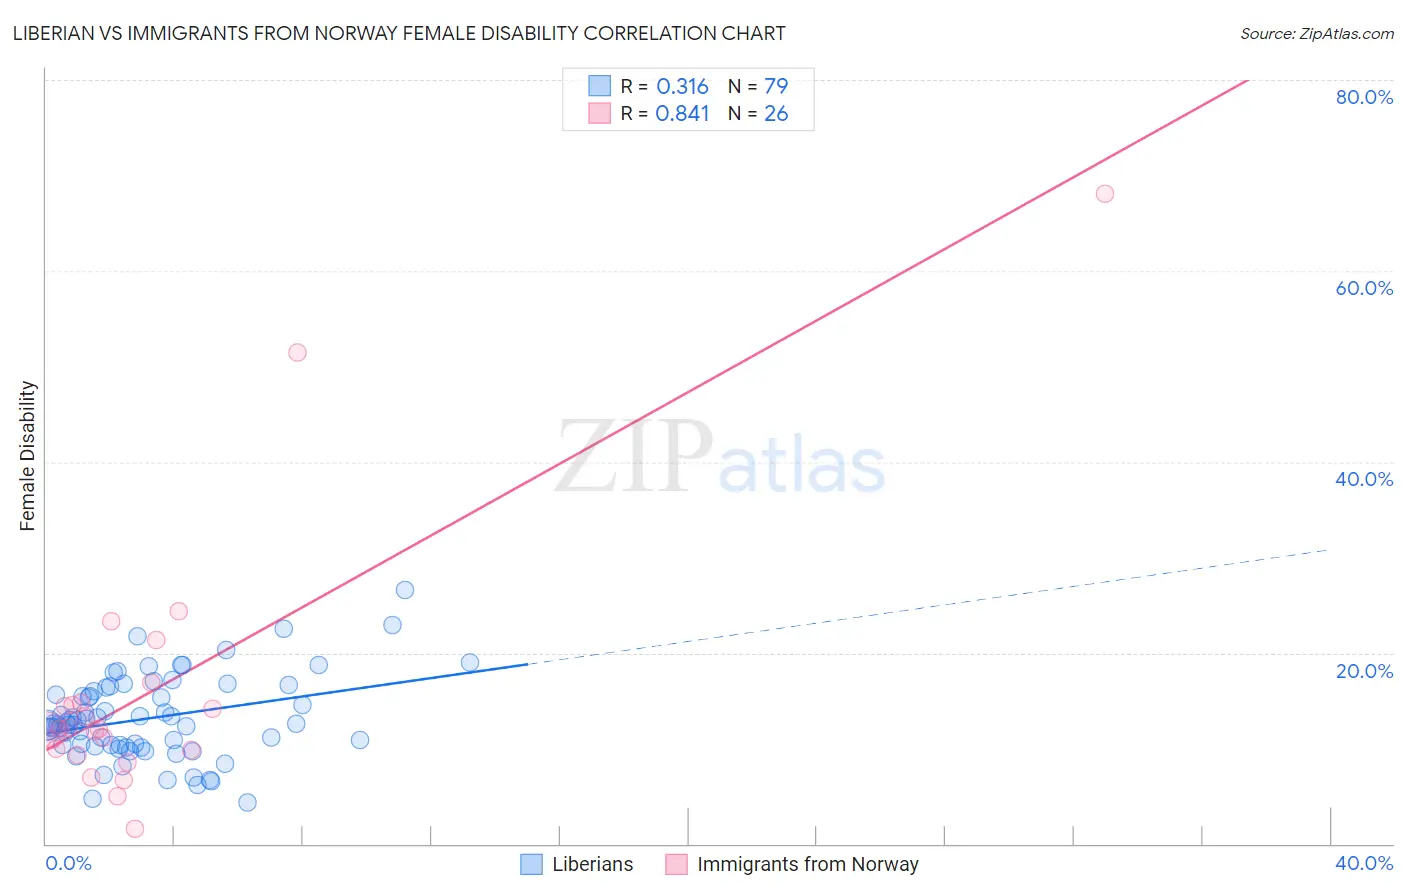
Liberian vs Immigrants from Norway Female Disability Correlation Chart
The statistical analysis conducted on geographies consisting of 118,083,063 people shows a mild positive correlation between the proportion of Liberians and percentage of females with a disability in the United States with a correlation coefficient (R) of 0.316 and weighted average of 12.7%. Similarly, the statistical analysis conducted on geographies consisting of 116,702,841 people shows a very strong positive correlation between the proportion of Immigrants from Norway and percentage of females with a disability in the United States with a correlation coefficient (R) of 0.841 and weighted average of 11.9%, a difference of 7.0%.
Female Disability Correlation Summary
| Measurement | Liberian | Immigrants from Norway |
| Minimum | 4.4% | 1.5% |
| Maximum | 26.5% | 68.1% |
| Range | 22.2% | 66.6% |
| Mean | 13.1% | 16.0% |
| Median | 12.5% | 12.0% |
| Interquartile 25% (IQ1) | 10.3% | 9.8% |
| Interquartile 75% (IQ3) | 15.9% | 14.8% |
| Interquartile Range (IQR) | 5.6% | 5.0% |
| Standard Deviation (Sample) | 4.3% | 14.1% |
| Standard Deviation (Population) | 4.3% | 13.8% |
Similar Demographics by Female Disability
Demographics Similar to Liberians by Female Disability
In terms of female disability, the demographic groups most similar to Liberians are Aleut (12.7%, a difference of 0.0%), British West Indian (12.7%, a difference of 0.030%), Immigrants from Armenia (12.7%, a difference of 0.080%), Immigrants from Germany (12.7%, a difference of 0.10%), and Subsaharan African (12.7%, a difference of 0.10%).
| Demographics | Rating | Rank | Female Disability |
| Slovenes | 1.7 /100 | #250 | Tragic 12.7% |
| Crow | 1.6 /100 | #251 | Tragic 12.7% |
| Immigrants | Caribbean | 1.4 /100 | #252 | Tragic 12.7% |
| Jamaicans | 1.4 /100 | #253 | Tragic 12.7% |
| Hawaiians | 1.4 /100 | #254 | Tragic 12.7% |
| Immigrants | Germany | 1.3 /100 | #255 | Tragic 12.7% |
| British West Indians | 1.2 /100 | #256 | Tragic 12.7% |
| Liberians | 1.1 /100 | #257 | Tragic 12.7% |
| Aleuts | 1.1 /100 | #258 | Tragic 12.7% |
| Immigrants | Armenia | 1.0 /100 | #259 | Tragic 12.7% |
| Sub-Saharan Africans | 1.0 /100 | #260 | Tragic 12.7% |
| Bermudans | 1.0 /100 | #261 | Tragic 12.7% |
| Czechoslovakians | 0.9 /100 | #262 | Tragic 12.7% |
| Spaniards | 0.7 /100 | #263 | Tragic 12.8% |
| Alaska Natives | 0.6 /100 | #264 | Tragic 12.8% |
Demographics Similar to Immigrants from Norway by Female Disability
In terms of female disability, the demographic groups most similar to Immigrants from Norway are Ugandan (11.9%, a difference of 0.040%), Central American (11.9%, a difference of 0.060%), Ecuadorian (11.9%, a difference of 0.060%), Kenyan (11.9%, a difference of 0.13%), and Immigrants from Nicaragua (11.9%, a difference of 0.13%).
| Demographics | Rating | Rank | Female Disability |
| Nicaraguans | 95.2 /100 | #130 | Exceptional 11.9% |
| Arabs | 95.1 /100 | #131 | Exceptional 11.9% |
| Immigrants | Syria | 94.6 /100 | #132 | Exceptional 11.9% |
| Kenyans | 94.5 /100 | #133 | Exceptional 11.9% |
| Immigrants | Nicaragua | 94.5 /100 | #134 | Exceptional 11.9% |
| Central Americans | 94.2 /100 | #135 | Exceptional 11.9% |
| Ugandans | 94.0 /100 | #136 | Exceptional 11.9% |
| Immigrants | Norway | 93.8 /100 | #137 | Exceptional 11.9% |
| Ecuadorians | 93.4 /100 | #138 | Exceptional 11.9% |
| Immigrants | Hungary | 92.8 /100 | #139 | Exceptional 11.9% |
| Romanians | 91.6 /100 | #140 | Exceptional 11.9% |
| Immigrants | Ecuador | 91.5 /100 | #141 | Exceptional 11.9% |
| Immigrants | Africa | 90.0 /100 | #142 | Excellent 11.9% |
| Immigrants | Sudan | 89.6 /100 | #143 | Excellent 11.9% |
| Immigrants | Austria | 87.9 /100 | #144 | Excellent 12.0% |