New Zealander vs Bermudan Cognitive Disability
COMPARE
New Zealander
Bermudan
Cognitive Disability
Cognitive Disability Comparison
New Zealanders
Bermudans
17.4%
COGNITIVE DISABILITY
21.1/ 100
METRIC RATING
195th/ 347
METRIC RANK
18.1%
COGNITIVE DISABILITY
0.1/ 100
METRIC RATING
285th/ 347
METRIC RANK
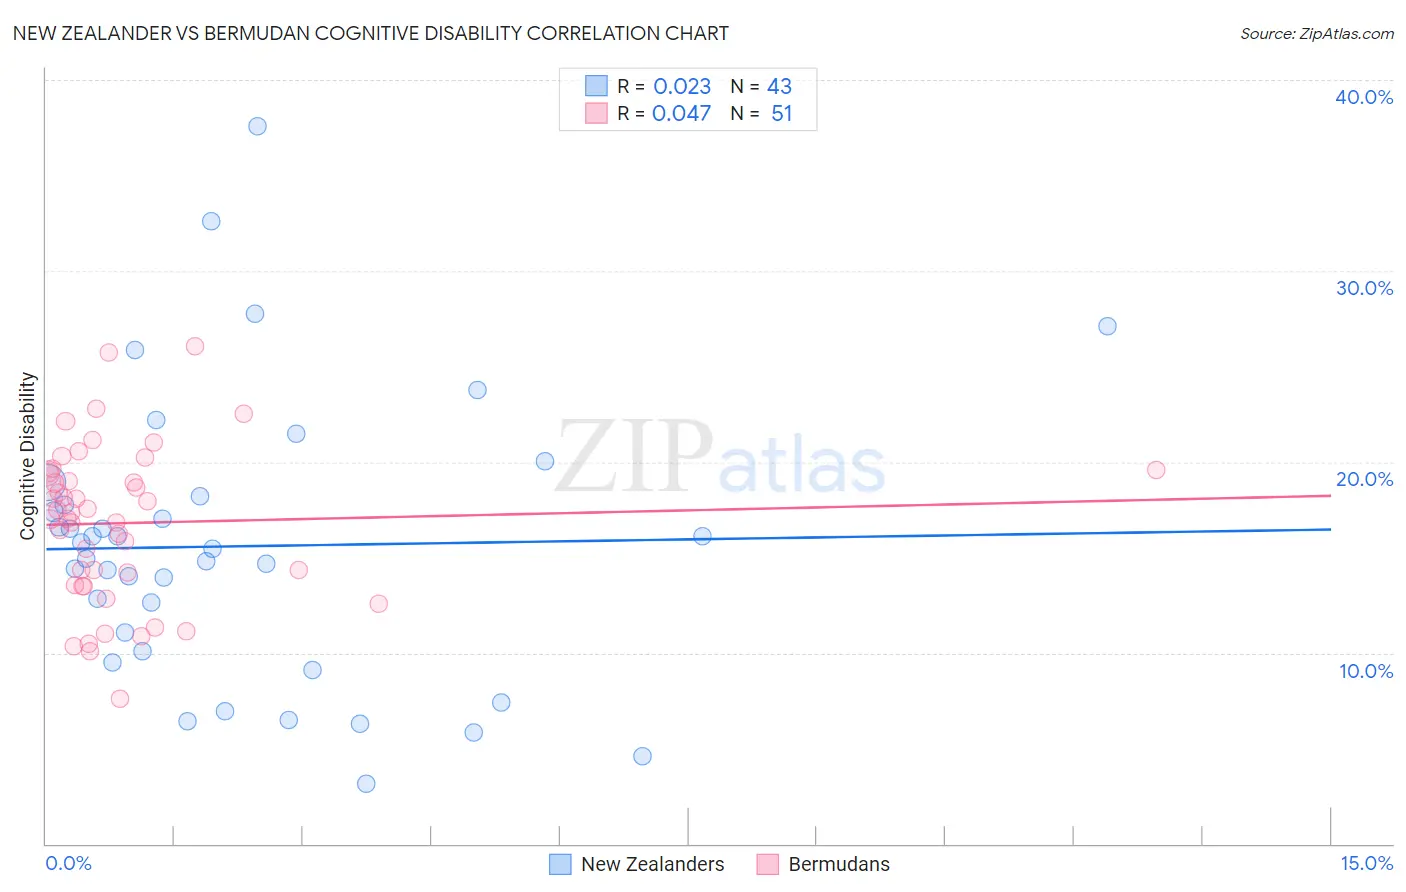
New Zealander vs Bermudan Cognitive Disability Correlation Chart
The statistical analysis conducted on geographies consisting of 106,922,503 people shows no correlation between the proportion of New Zealanders and percentage of population with cognitive disability in the United States with a correlation coefficient (R) of 0.023 and weighted average of 17.4%. Similarly, the statistical analysis conducted on geographies consisting of 55,721,081 people shows no correlation between the proportion of Bermudans and percentage of population with cognitive disability in the United States with a correlation coefficient (R) of 0.047 and weighted average of 18.1%, a difference of 3.9%.
Cognitive Disability Correlation Summary
| Measurement | New Zealander | Bermudan |
| Minimum | 3.1% | 7.6% |
| Maximum | 37.6% | 26.1% |
| Range | 34.5% | 18.5% |
| Mean | 15.6% | 16.8% |
| Median | 15.4% | 17.4% |
| Interquartile 25% (IQ1) | 10.1% | 13.6% |
| Interquartile 75% (IQ3) | 18.2% | 19.5% |
| Interquartile Range (IQR) | 8.2% | 5.9% |
| Standard Deviation (Sample) | 7.4% | 4.1% |
| Standard Deviation (Population) | 7.3% | 4.0% |
Similar Demographics by Cognitive Disability
Demographics Similar to New Zealanders by Cognitive Disability
In terms of cognitive disability, the demographic groups most similar to New Zealanders are Immigrants from Bosnia and Herzegovina (17.4%, a difference of 0.040%), Guyanese (17.5%, a difference of 0.16%), Delaware (17.4%, a difference of 0.18%), Immigrants from Afghanistan (17.5%, a difference of 0.20%), and Immigrants from Haiti (17.4%, a difference of 0.23%).
| Demographics | Rating | Rank | Cognitive Disability |
| Immigrants | France | 29.8 /100 | #188 | Fair 17.4% |
| Immigrants | Western Asia | 29.5 /100 | #189 | Fair 17.4% |
| Immigrants | Spain | 27.7 /100 | #190 | Fair 17.4% |
| Immigrants | Nonimmigrants | 27.4 /100 | #191 | Fair 17.4% |
| Immigrants | Haiti | 27.1 /100 | #192 | Fair 17.4% |
| Delaware | 25.6 /100 | #193 | Fair 17.4% |
| Immigrants | Bosnia and Herzegovina | 22.0 /100 | #194 | Fair 17.4% |
| New Zealanders | 21.1 /100 | #195 | Fair 17.4% |
| Guyanese | 17.5 /100 | #196 | Poor 17.5% |
| Immigrants | Afghanistan | 16.7 /100 | #197 | Poor 17.5% |
| Immigrants | Panama | 14.8 /100 | #198 | Poor 17.5% |
| Immigrants | Singapore | 14.3 /100 | #199 | Poor 17.5% |
| Haitians | 14.1 /100 | #200 | Poor 17.5% |
| South American Indians | 13.0 /100 | #201 | Poor 17.5% |
| Immigrants | Morocco | 12.0 /100 | #202 | Poor 17.5% |
Demographics Similar to Bermudans by Cognitive Disability
In terms of cognitive disability, the demographic groups most similar to Bermudans are Immigrants from Uganda (18.1%, a difference of 0.010%), Kenyan (18.1%, a difference of 0.040%), Nigerian (18.1%, a difference of 0.050%), Immigrants from Cambodia (18.1%, a difference of 0.080%), and Dutch West Indian (18.1%, a difference of 0.080%).
| Demographics | Rating | Rank | Cognitive Disability |
| Immigrants | Micronesia | 0.2 /100 | #278 | Tragic 18.1% |
| Chippewa | 0.1 /100 | #279 | Tragic 18.1% |
| West Indians | 0.1 /100 | #280 | Tragic 18.1% |
| Yakama | 0.1 /100 | #281 | Tragic 18.1% |
| Immigrants | Cambodia | 0.1 /100 | #282 | Tragic 18.1% |
| Nigerians | 0.1 /100 | #283 | Tragic 18.1% |
| Immigrants | Uganda | 0.1 /100 | #284 | Tragic 18.1% |
| Bermudans | 0.1 /100 | #285 | Tragic 18.1% |
| Kenyans | 0.1 /100 | #286 | Tragic 18.1% |
| Dutch West Indians | 0.1 /100 | #287 | Tragic 18.1% |
| Immigrants | West Indies | 0.1 /100 | #288 | Tragic 18.1% |
| Natives/Alaskans | 0.1 /100 | #289 | Tragic 18.1% |
| Immigrants | Africa | 0.1 /100 | #290 | Tragic 18.1% |
| Ottawa | 0.1 /100 | #291 | Tragic 18.2% |
| Iroquois | 0.1 /100 | #292 | Tragic 18.2% |