Immigrants from Caribbean vs Yaqui Vision Disability
COMPARE
Immigrants from Caribbean
Yaqui
Vision Disability
Vision Disability Comparison
Immigrants from Caribbean
Yaqui
2.5%
VISION DISABILITY
0.0/ 100
METRIC RATING
282nd/ 347
METRIC RANK
2.5%
VISION DISABILITY
0.0/ 100
METRIC RATING
293rd/ 347
METRIC RANK
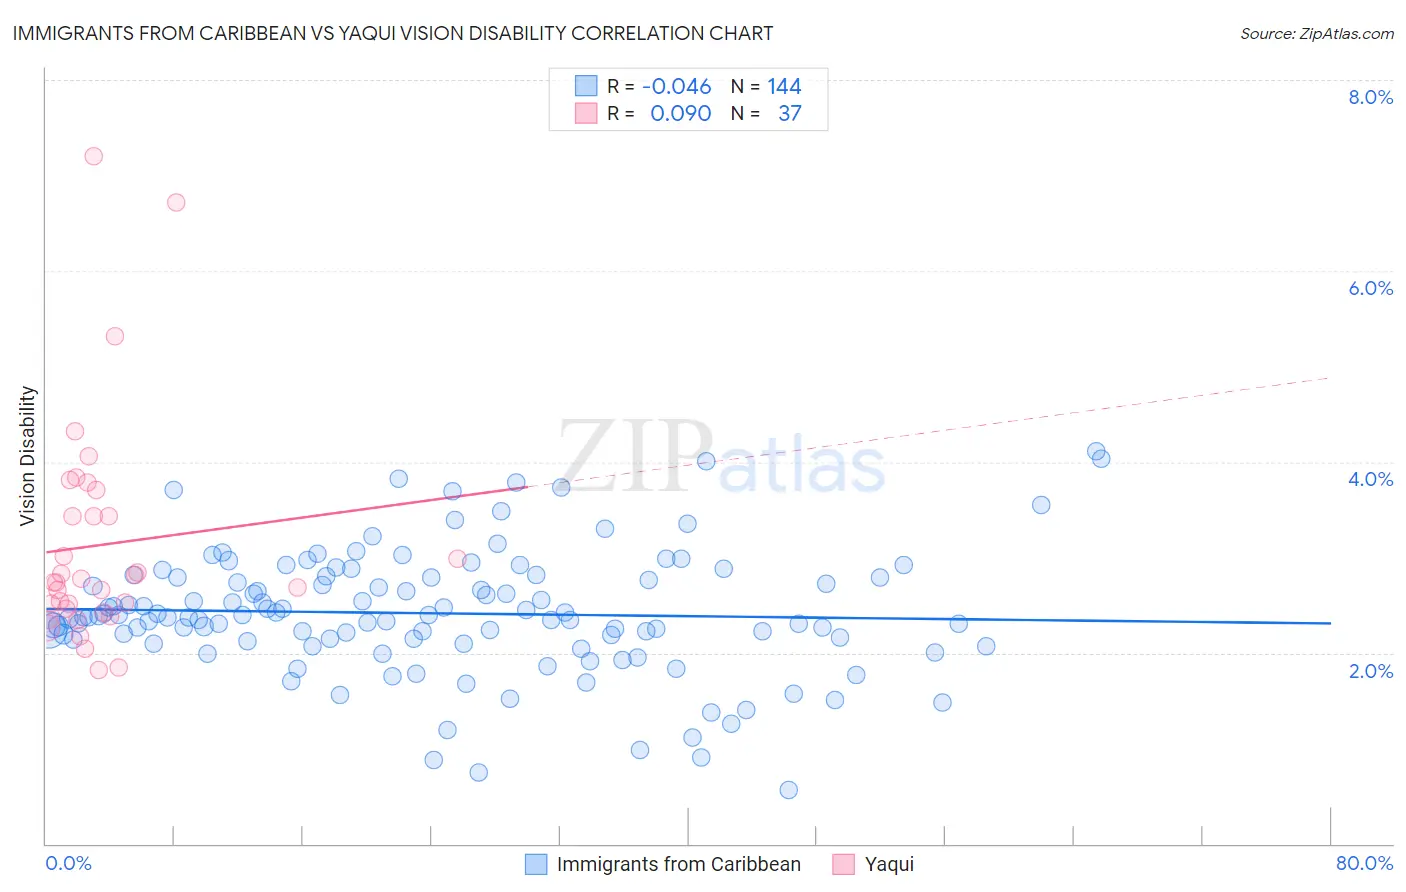
Immigrants from Caribbean vs Yaqui Vision Disability Correlation Chart
The statistical analysis conducted on geographies consisting of 449,351,147 people shows no correlation between the proportion of Immigrants from Caribbean and percentage of population with vision disability in the United States with a correlation coefficient (R) of -0.046 and weighted average of 2.5%. Similarly, the statistical analysis conducted on geographies consisting of 107,692,151 people shows a slight positive correlation between the proportion of Yaqui and percentage of population with vision disability in the United States with a correlation coefficient (R) of 0.090 and weighted average of 2.5%, a difference of 1.7%.
Vision Disability Correlation Summary
| Measurement | Immigrants from Caribbean | Yaqui |
| Minimum | 0.56% | 1.8% |
| Maximum | 4.1% | 7.2% |
| Range | 3.5% | 5.4% |
| Mean | 2.4% | 3.1% |
| Median | 2.4% | 2.7% |
| Interquartile 25% (IQ1) | 2.1% | 2.4% |
| Interquartile 75% (IQ3) | 2.8% | 3.6% |
| Interquartile Range (IQR) | 0.66% | 1.1% |
| Standard Deviation (Sample) | 0.65% | 1.2% |
| Standard Deviation (Population) | 0.65% | 1.2% |
Demographics Similar to Immigrants from Caribbean and Yaqui by Vision Disability
In terms of vision disability, the demographic groups most similar to Immigrants from Caribbean are U.S. Virgin Islander (2.5%, a difference of 0.12%), Puget Sound Salish (2.5%, a difference of 0.13%), Cape Verdean (2.4%, a difference of 0.35%), Nepalese (2.4%, a difference of 0.39%), and Spanish (2.4%, a difference of 0.40%). Similarly, the demographic groups most similar to Yaqui are Crow (2.5%, a difference of 0.030%), Immigrants from Honduras (2.5%, a difference of 0.12%), Ottawa (2.5%, a difference of 0.34%), Immigrants from Cuba (2.5%, a difference of 0.52%), and Delaware (2.5%, a difference of 0.55%).
| Demographics | Rating | Rank | Vision Disability |
| Bahamians | 0.0 /100 | #277 | Tragic 2.4% |
| Spanish | 0.0 /100 | #278 | Tragic 2.4% |
| Nepalese | 0.0 /100 | #279 | Tragic 2.4% |
| Cape Verdeans | 0.0 /100 | #280 | Tragic 2.4% |
| U.S. Virgin Islanders | 0.0 /100 | #281 | Tragic 2.5% |
| Immigrants | Caribbean | 0.0 /100 | #282 | Tragic 2.5% |
| Puget Sound Salish | 0.0 /100 | #283 | Tragic 2.5% |
| Yakama | 0.0 /100 | #284 | Tragic 2.5% |
| Immigrants | Central America | 0.0 /100 | #285 | Tragic 2.5% |
| Sioux | 0.0 /100 | #286 | Tragic 2.5% |
| Hondurans | 0.0 /100 | #287 | Tragic 2.5% |
| French American Indians | 0.0 /100 | #288 | Tragic 2.5% |
| Immigrants | Nonimmigrants | 0.0 /100 | #289 | Tragic 2.5% |
| Immigrants | Cuba | 0.0 /100 | #290 | Tragic 2.5% |
| Immigrants | Honduras | 0.0 /100 | #291 | Tragic 2.5% |
| Crow | 0.0 /100 | #292 | Tragic 2.5% |
| Yaqui | 0.0 /100 | #293 | Tragic 2.5% |
| Ottawa | 0.0 /100 | #294 | Tragic 2.5% |
| Delaware | 0.0 /100 | #295 | Tragic 2.5% |
| Immigrants | Mexico | 0.0 /100 | #296 | Tragic 2.5% |
| Immigrants | Dominica | 0.0 /100 | #297 | Tragic 2.5% |