Lumbee vs Ukrainian Disability Age 35 to 64
COMPARE
Lumbee
Ukrainian
Disability Age 35 to 64
Disability Age 35 to 64 Comparison
Lumbee
Ukrainians
17.6%
DISABILITY AGE 35 TO 64
0.0/ 100
METRIC RATING
346th/ 347
METRIC RANK
11.0%
DISABILITY AGE 35 TO 64
78.0/ 100
METRIC RATING
152nd/ 347
METRIC RANK
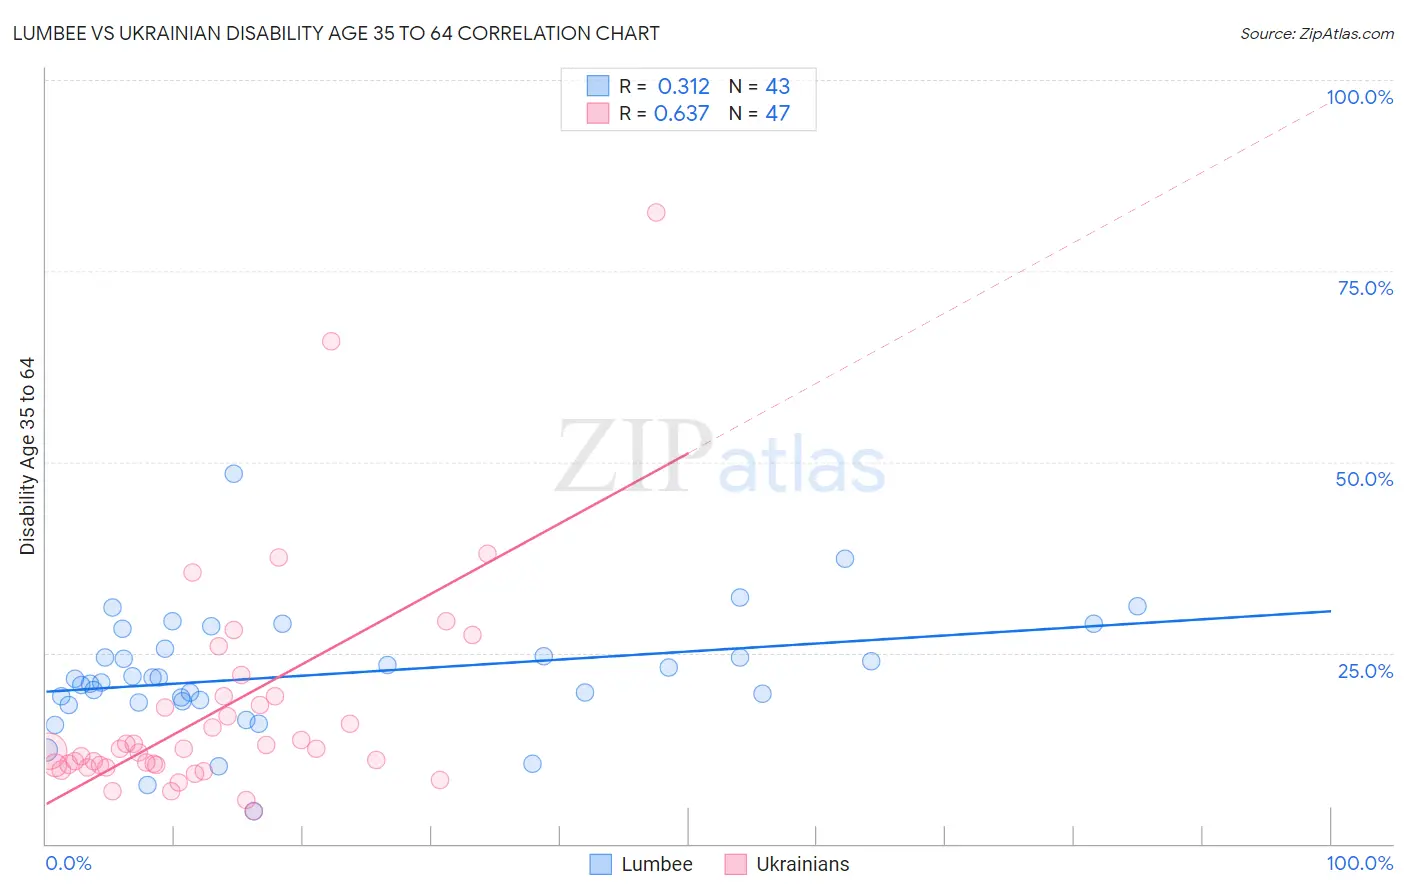
Lumbee vs Ukrainian Disability Age 35 to 64 Correlation Chart
The statistical analysis conducted on geographies consisting of 92,257,534 people shows a mild positive correlation between the proportion of Lumbee and percentage of population with a disability between the ages 34 and 64 in the United States with a correlation coefficient (R) of 0.312 and weighted average of 17.6%. Similarly, the statistical analysis conducted on geographies consisting of 448,204,530 people shows a significant positive correlation between the proportion of Ukrainians and percentage of population with a disability between the ages 34 and 64 in the United States with a correlation coefficient (R) of 0.637 and weighted average of 11.0%, a difference of 60.7%.
Disability Age 35 to 64 Correlation Summary
| Measurement | Lumbee | Ukrainian |
| Minimum | 4.3% | 4.3% |
| Maximum | 48.5% | 82.6% |
| Range | 44.2% | 78.4% |
| Mean | 22.1% | 17.5% |
| Median | 21.6% | 12.4% |
| Interquartile 25% (IQ1) | 18.7% | 10.3% |
| Interquartile 75% (IQ3) | 25.5% | 19.3% |
| Interquartile Range (IQR) | 6.8% | 9.1% |
| Standard Deviation (Sample) | 7.8% | 14.6% |
| Standard Deviation (Population) | 7.7% | 14.5% |
Similar Demographics by Disability Age 35 to 64
Demographics Similar to Lumbee by Disability Age 35 to 64
In terms of disability age 35 to 64, the demographic groups most similar to Lumbee are Kiowa (17.4%, a difference of 1.7%), Yup'ik (16.9%, a difference of 4.2%), Creek (16.9%, a difference of 4.5%), Tohono O'odham (16.7%, a difference of 5.4%), and Tsimshian (16.7%, a difference of 5.5%).
| Demographics | Rating | Rank | Disability Age 35 to 64 |
| Yuman | 0.0 /100 | #333 | Tragic 15.8% |
| Colville | 0.0 /100 | #334 | Tragic 15.8% |
| Seminole | 0.0 /100 | #335 | Tragic 15.9% |
| Menominee | 0.0 /100 | #336 | Tragic 15.9% |
| Puerto Ricans | 0.0 /100 | #337 | Tragic 15.9% |
| Chickasaw | 0.0 /100 | #338 | Tragic 16.1% |
| Pima | 0.0 /100 | #339 | Tragic 16.1% |
| Choctaw | 0.0 /100 | #340 | Tragic 16.4% |
| Tsimshian | 0.0 /100 | #341 | Tragic 16.7% |
| Tohono O'odham | 0.0 /100 | #342 | Tragic 16.7% |
| Creek | 0.0 /100 | #343 | Tragic 16.9% |
| Yup'ik | 0.0 /100 | #344 | Tragic 16.9% |
| Kiowa | 0.0 /100 | #345 | Tragic 17.4% |
| Lumbee | 0.0 /100 | #346 | Tragic 17.6% |
| Houma | 0.0 /100 | #347 | Tragic 18.7% |
Demographics Similar to Ukrainians by Disability Age 35 to 64
In terms of disability age 35 to 64, the demographic groups most similar to Ukrainians are Immigrants from England (11.0%, a difference of 0.080%), Immigrants from Canada (11.0%, a difference of 0.15%), New Zealander (11.0%, a difference of 0.16%), Moroccan (11.0%, a difference of 0.19%), and Immigrants from Sierra Leone (11.0%, a difference of 0.21%).
| Demographics | Rating | Rank | Disability Age 35 to 64 |
| Immigrants | Bangladesh | 85.6 /100 | #145 | Excellent 10.9% |
| South American Indians | 83.5 /100 | #146 | Excellent 10.9% |
| Immigrants | Eritrea | 83.4 /100 | #147 | Excellent 10.9% |
| Arabs | 82.7 /100 | #148 | Excellent 10.9% |
| Immigrants | Cameroon | 81.1 /100 | #149 | Excellent 10.9% |
| Syrians | 79.8 /100 | #150 | Good 11.0% |
| New Zealanders | 79.3 /100 | #151 | Good 11.0% |
| Ukrainians | 78.0 /100 | #152 | Good 11.0% |
| Immigrants | England | 77.4 /100 | #153 | Good 11.0% |
| Immigrants | Canada | 76.7 /100 | #154 | Good 11.0% |
| Moroccans | 76.4 /100 | #155 | Good 11.0% |
| Immigrants | Sierra Leone | 76.2 /100 | #156 | Good 11.0% |
| Guyanese | 75.1 /100 | #157 | Good 11.0% |
| Immigrants | North America | 74.9 /100 | #158 | Good 11.0% |
| Serbians | 73.6 /100 | #159 | Good 11.0% |