Lumbee vs Icelander Disability Age 35 to 64
COMPARE
Lumbee
Icelander
Disability Age 35 to 64
Disability Age 35 to 64 Comparison
Lumbee
Icelanders
17.6%
DISABILITY AGE 35 TO 64
0.0/ 100
METRIC RATING
346th/ 347
METRIC RANK
11.4%
DISABILITY AGE 35 TO 64
39.7/ 100
METRIC RATING
182nd/ 347
METRIC RANK
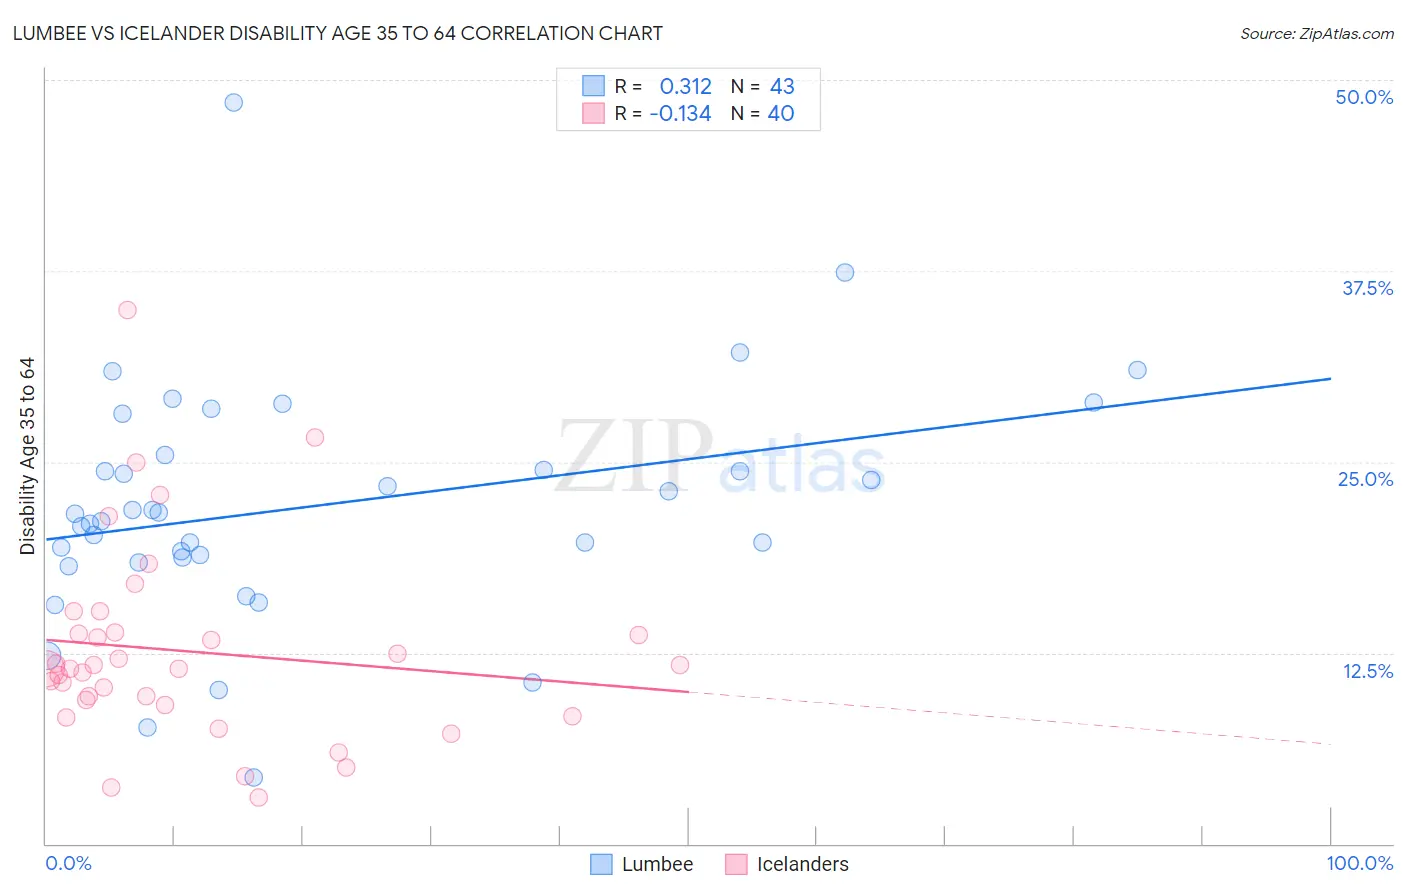
Lumbee vs Icelander Disability Age 35 to 64 Correlation Chart
The statistical analysis conducted on geographies consisting of 92,257,534 people shows a mild positive correlation between the proportion of Lumbee and percentage of population with a disability between the ages 34 and 64 in the United States with a correlation coefficient (R) of 0.312 and weighted average of 17.6%. Similarly, the statistical analysis conducted on geographies consisting of 159,603,880 people shows a poor negative correlation between the proportion of Icelanders and percentage of population with a disability between the ages 34 and 64 in the United States with a correlation coefficient (R) of -0.134 and weighted average of 11.4%, a difference of 55.3%.
Disability Age 35 to 64 Correlation Summary
| Measurement | Lumbee | Icelander |
| Minimum | 4.3% | 3.0% |
| Maximum | 48.5% | 34.9% |
| Range | 44.2% | 31.9% |
| Mean | 22.1% | 12.6% |
| Median | 21.6% | 11.5% |
| Interquartile 25% (IQ1) | 18.7% | 9.2% |
| Interquartile 75% (IQ3) | 25.5% | 13.8% |
| Interquartile Range (IQR) | 6.8% | 4.5% |
| Standard Deviation (Sample) | 7.8% | 6.4% |
| Standard Deviation (Population) | 7.7% | 6.3% |
Similar Demographics by Disability Age 35 to 64
Demographics Similar to Lumbee by Disability Age 35 to 64
In terms of disability age 35 to 64, the demographic groups most similar to Lumbee are Kiowa (17.4%, a difference of 1.7%), Yup'ik (16.9%, a difference of 4.2%), Creek (16.9%, a difference of 4.5%), Tohono O'odham (16.7%, a difference of 5.4%), and Tsimshian (16.7%, a difference of 5.5%).
| Demographics | Rating | Rank | Disability Age 35 to 64 |
| Yuman | 0.0 /100 | #333 | Tragic 15.8% |
| Colville | 0.0 /100 | #334 | Tragic 15.8% |
| Seminole | 0.0 /100 | #335 | Tragic 15.9% |
| Menominee | 0.0 /100 | #336 | Tragic 15.9% |
| Puerto Ricans | 0.0 /100 | #337 | Tragic 15.9% |
| Chickasaw | 0.0 /100 | #338 | Tragic 16.1% |
| Pima | 0.0 /100 | #339 | Tragic 16.1% |
| Choctaw | 0.0 /100 | #340 | Tragic 16.4% |
| Tsimshian | 0.0 /100 | #341 | Tragic 16.7% |
| Tohono O'odham | 0.0 /100 | #342 | Tragic 16.7% |
| Creek | 0.0 /100 | #343 | Tragic 16.9% |
| Yup'ik | 0.0 /100 | #344 | Tragic 16.9% |
| Kiowa | 0.0 /100 | #345 | Tragic 17.4% |
| Lumbee | 0.0 /100 | #346 | Tragic 17.6% |
| Houma | 0.0 /100 | #347 | Tragic 18.7% |
Demographics Similar to Icelanders by Disability Age 35 to 64
In terms of disability age 35 to 64, the demographic groups most similar to Icelanders are Immigrants from Oceania (11.4%, a difference of 0.020%), Kenyan (11.4%, a difference of 0.040%), Trinidadian and Tobagonian (11.4%, a difference of 0.090%), Immigrants from Barbados (11.3%, a difference of 0.15%), and Immigrants from Caribbean (11.3%, a difference of 0.15%).
| Demographics | Rating | Rank | Disability Age 35 to 64 |
| Czechs | 47.9 /100 | #175 | Average 11.3% |
| Ugandans | 43.7 /100 | #176 | Average 11.3% |
| Immigrants | Eastern Africa | 42.2 /100 | #177 | Average 11.3% |
| Poles | 42.0 /100 | #178 | Average 11.3% |
| Immigrants | Barbados | 41.6 /100 | #179 | Average 11.3% |
| Immigrants | Caribbean | 41.5 /100 | #180 | Average 11.3% |
| Trinidadians and Tobagonians | 40.8 /100 | #181 | Average 11.4% |
| Icelanders | 39.7 /100 | #182 | Fair 11.4% |
| Immigrants | Oceania | 39.5 /100 | #183 | Fair 11.4% |
| Kenyans | 39.2 /100 | #184 | Fair 11.4% |
| Danes | 36.8 /100 | #185 | Fair 11.4% |
| Slovenes | 36.6 /100 | #186 | Fair 11.4% |
| Immigrants | Bosnia and Herzegovina | 35.2 /100 | #187 | Fair 11.4% |
| Northern Europeans | 34.9 /100 | #188 | Fair 11.4% |
| Hungarians | 34.6 /100 | #189 | Fair 11.4% |