Chippewa vs Seminole Disability Age Over 75
COMPARE
Chippewa
Seminole
Disability Age Over 75
Disability Age Over 75 Comparison
Chippewa
Seminole
48.4%
DISABILITY AGE OVER 75
1.6/ 100
METRIC RATING
246th/ 347
METRIC RANK
51.5%
DISABILITY AGE OVER 75
0.0/ 100
METRIC RATING
318th/ 347
METRIC RANK
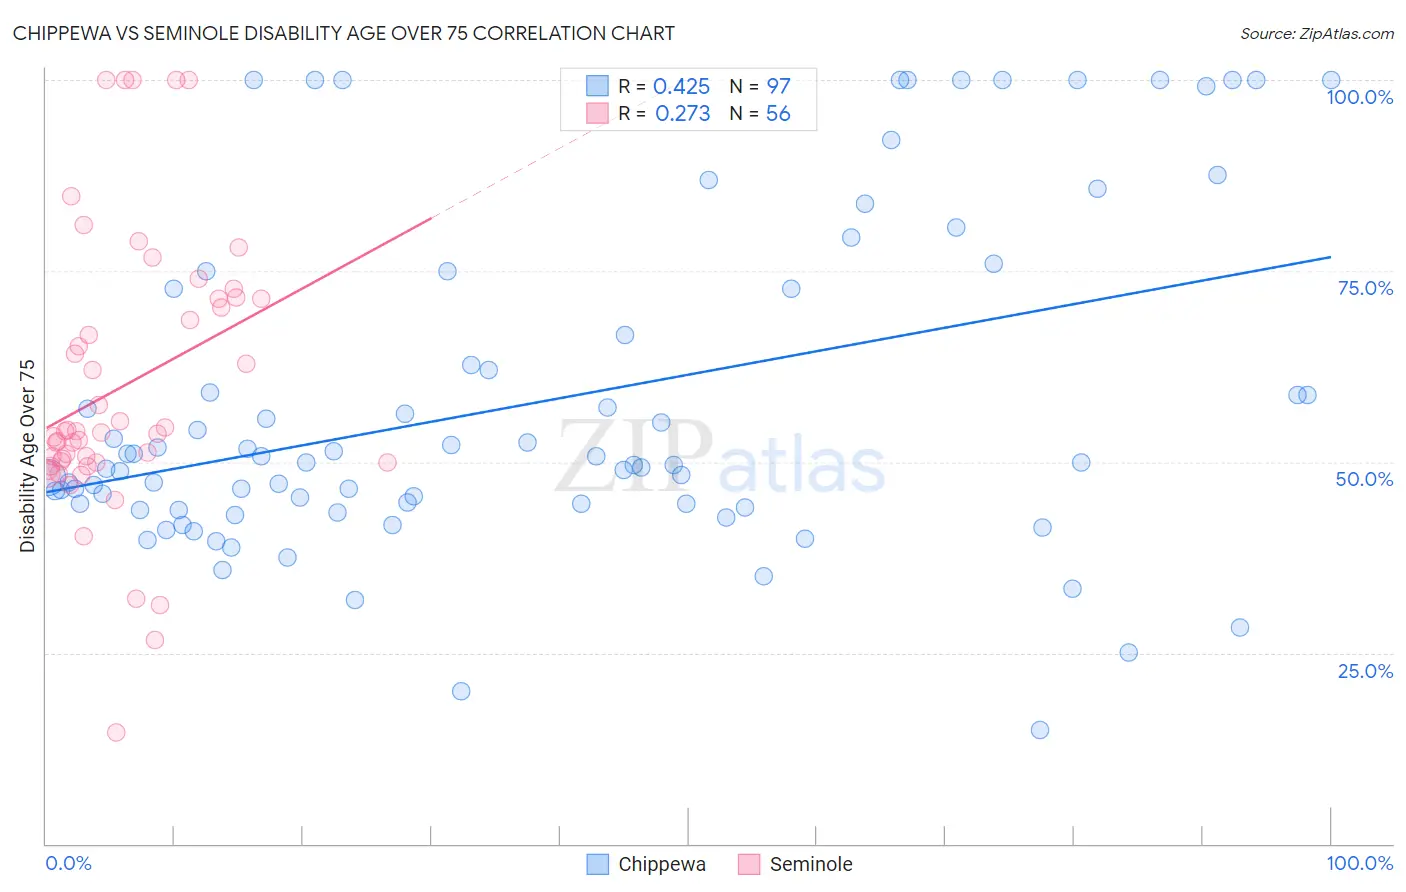
Chippewa vs Seminole Disability Age Over 75 Correlation Chart
The statistical analysis conducted on geographies consisting of 214,728,280 people shows a moderate positive correlation between the proportion of Chippewa and percentage of population with a disability over the age of 75 in the United States with a correlation coefficient (R) of 0.425 and weighted average of 48.4%. Similarly, the statistical analysis conducted on geographies consisting of 118,267,325 people shows a weak positive correlation between the proportion of Seminole and percentage of population with a disability over the age of 75 in the United States with a correlation coefficient (R) of 0.273 and weighted average of 51.5%, a difference of 6.2%.
Disability Age Over 75 Correlation Summary
| Measurement | Chippewa | Seminole |
| Minimum | 14.8% | 14.6% |
| Maximum | 100.0% | 100.0% |
| Range | 85.2% | 85.4% |
| Mean | 57.7% | 59.9% |
| Median | 50.0% | 53.9% |
| Interquartile 25% (IQ1) | 44.2% | 50.0% |
| Interquartile 75% (IQ3) | 72.7% | 71.4% |
| Interquartile Range (IQR) | 28.5% | 21.4% |
| Standard Deviation (Sample) | 21.7% | 18.4% |
| Standard Deviation (Population) | 21.6% | 18.2% |
Similar Demographics by Disability Age Over 75
Demographics Similar to Chippewa by Disability Age Over 75
In terms of disability age over 75, the demographic groups most similar to Chippewa are Iroquois (48.4%, a difference of 0.020%), American (48.4%, a difference of 0.030%), Afghan (48.4%, a difference of 0.060%), Sri Lankan (48.5%, a difference of 0.080%), and Immigrants from Caribbean (48.4%, a difference of 0.14%).
| Demographics | Rating | Rank | Disability Age Over 75 |
| Immigrants | Thailand | 2.8 /100 | #239 | Tragic 48.3% |
| Tongans | 2.3 /100 | #240 | Tragic 48.3% |
| Native Hawaiians | 2.2 /100 | #241 | Tragic 48.3% |
| French American Indians | 2.2 /100 | #242 | Tragic 48.3% |
| Immigrants | Caribbean | 2.1 /100 | #243 | Tragic 48.4% |
| Afghans | 1.8 /100 | #244 | Tragic 48.4% |
| Americans | 1.7 /100 | #245 | Tragic 48.4% |
| Chippewa | 1.6 /100 | #246 | Tragic 48.4% |
| Iroquois | 1.6 /100 | #247 | Tragic 48.4% |
| Sri Lankans | 1.4 /100 | #248 | Tragic 48.5% |
| Iraqis | 1.0 /100 | #249 | Tragic 48.6% |
| West Indians | 0.8 /100 | #250 | Tragic 48.6% |
| Koreans | 0.8 /100 | #251 | Tragic 48.6% |
| Immigrants | South Eastern Asia | 0.7 /100 | #252 | Tragic 48.7% |
| British West Indians | 0.6 /100 | #253 | Tragic 48.7% |
Demographics Similar to Seminole by Disability Age Over 75
In terms of disability age over 75, the demographic groups most similar to Seminole are Creek (51.5%, a difference of 0.0%), Paiute (51.5%, a difference of 0.14%), Dutch West Indian (51.5%, a difference of 0.15%), Yakama (51.3%, a difference of 0.33%), and Comanche (51.7%, a difference of 0.49%).
| Demographics | Rating | Rank | Disability Age Over 75 |
| Cajuns | 0.0 /100 | #311 | Tragic 50.7% |
| Cheyenne | 0.0 /100 | #312 | Tragic 50.9% |
| Immigrants | Azores | 0.0 /100 | #313 | Tragic 50.9% |
| Immigrants | Mexico | 0.0 /100 | #314 | Tragic 51.1% |
| Mexicans | 0.0 /100 | #315 | Tragic 51.1% |
| Chickasaw | 0.0 /100 | #316 | Tragic 51.2% |
| Yakama | 0.0 /100 | #317 | Tragic 51.3% |
| Seminole | 0.0 /100 | #318 | Tragic 51.5% |
| Creek | 0.0 /100 | #319 | Tragic 51.5% |
| Paiute | 0.0 /100 | #320 | Tragic 51.5% |
| Dutch West Indians | 0.0 /100 | #321 | Tragic 51.5% |
| Comanche | 0.0 /100 | #322 | Tragic 51.7% |
| Immigrants | Yemen | 0.0 /100 | #323 | Tragic 52.0% |
| Menominee | 0.0 /100 | #324 | Tragic 52.3% |
| Immigrants | Cabo Verde | 0.0 /100 | #325 | Tragic 52.4% |