Immigrants from Uzbekistan vs Bangladeshi Self-Care Disability
COMPARE
Immigrants from Uzbekistan
Bangladeshi
Self-Care Disability
Self-Care Disability Comparison
Immigrants from Uzbekistan
Bangladeshis
2.9%
SELF-CARE DISABILITY
0.0/ 100
METRIC RATING
325th/ 347
METRIC RANK
2.8%
SELF-CARE DISABILITY
0.0/ 100
METRIC RATING
309th/ 347
METRIC RANK
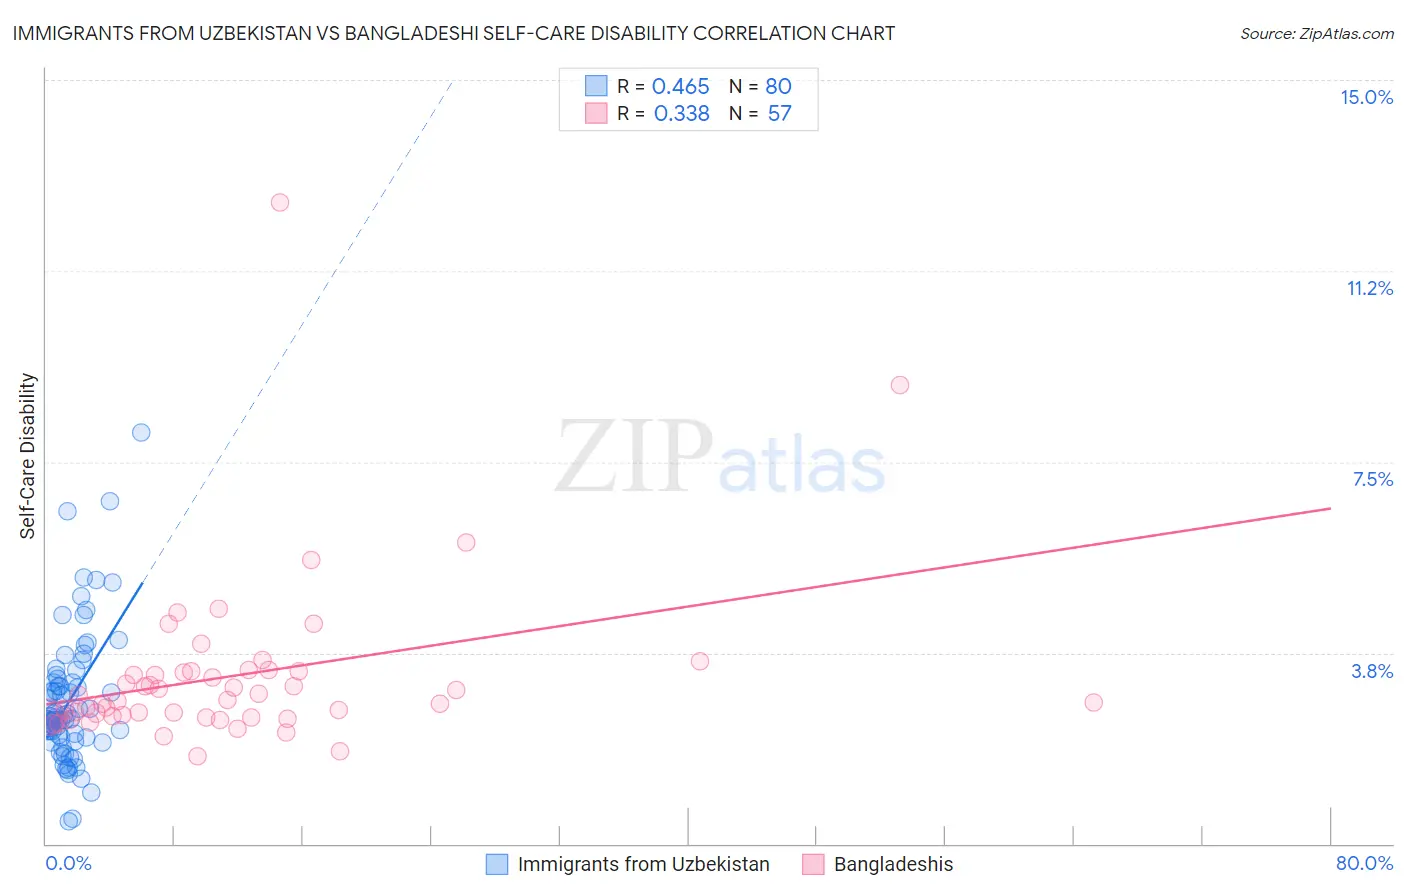
Immigrants from Uzbekistan vs Bangladeshi Self-Care Disability Correlation Chart
The statistical analysis conducted on geographies consisting of 118,703,600 people shows a moderate positive correlation between the proportion of Immigrants from Uzbekistan and percentage of population with self-care disability in the United States with a correlation coefficient (R) of 0.465 and weighted average of 2.9%. Similarly, the statistical analysis conducted on geographies consisting of 141,272,770 people shows a mild positive correlation between the proportion of Bangladeshis and percentage of population with self-care disability in the United States with a correlation coefficient (R) of 0.338 and weighted average of 2.8%, a difference of 2.7%.
Self-Care Disability Correlation Summary
| Measurement | Immigrants from Uzbekistan | Bangladeshi |
| Minimum | 0.43% | 1.7% |
| Maximum | 8.1% | 12.6% |
| Range | 7.6% | 10.9% |
| Mean | 2.8% | 3.3% |
| Median | 2.5% | 2.8% |
| Interquartile 25% (IQ1) | 2.1% | 2.5% |
| Interquartile 75% (IQ3) | 3.2% | 3.4% |
| Interquartile Range (IQR) | 1.1% | 0.90% |
| Standard Deviation (Sample) | 1.3% | 1.7% |
| Standard Deviation (Population) | 1.3% | 1.7% |
Demographics Similar to Immigrants from Uzbekistan and Bangladeshis by Self-Care Disability
In terms of self-care disability, the demographic groups most similar to Immigrants from Uzbekistan are Cherokee (2.9%, a difference of 0.53%), Seminole (2.9%, a difference of 0.63%), Comanche (2.9%, a difference of 0.75%), Paiute (2.9%, a difference of 0.94%), and Black/African American (2.9%, a difference of 1.0%). Similarly, the demographic groups most similar to Bangladeshis are British West Indian (2.8%, a difference of 0.10%), Immigrants from Grenada (2.8%, a difference of 0.15%), Puget Sound Salish (2.8%, a difference of 0.17%), Immigrants from Caribbean (2.8%, a difference of 0.36%), and Spanish American (2.8%, a difference of 0.40%).
| Demographics | Rating | Rank | Self-Care Disability |
| Natives/Alaskans | 0.0 /100 | #307 | Tragic 2.8% |
| Immigrants | Grenada | 0.0 /100 | #308 | Tragic 2.8% |
| Bangladeshis | 0.0 /100 | #309 | Tragic 2.8% |
| British West Indians | 0.0 /100 | #310 | Tragic 2.8% |
| Puget Sound Salish | 0.0 /100 | #311 | Tragic 2.8% |
| Immigrants | Caribbean | 0.0 /100 | #312 | Tragic 2.8% |
| Spanish Americans | 0.0 /100 | #313 | Tragic 2.8% |
| Creek | 0.0 /100 | #314 | Tragic 2.8% |
| Immigrants | Cuba | 0.0 /100 | #315 | Tragic 2.8% |
| Menominee | 0.0 /100 | #316 | Tragic 2.8% |
| Immigrants | Dominica | 0.0 /100 | #317 | Tragic 2.8% |
| Assyrians/Chaldeans/Syriacs | 0.0 /100 | #318 | Tragic 2.8% |
| Spanish American Indians | 0.0 /100 | #319 | Tragic 2.9% |
| Chickasaw | 0.0 /100 | #320 | Tragic 2.9% |
| Navajo | 0.0 /100 | #321 | Tragic 2.9% |
| Comanche | 0.0 /100 | #322 | Tragic 2.9% |
| Seminole | 0.0 /100 | #323 | Tragic 2.9% |
| Cherokee | 0.0 /100 | #324 | Tragic 2.9% |
| Immigrants | Uzbekistan | 0.0 /100 | #325 | Tragic 2.9% |
| Paiute | 0.0 /100 | #326 | Tragic 2.9% |
| Blacks/African Americans | 0.0 /100 | #327 | Tragic 2.9% |