Bahamian vs Pakistani Vision Disability
COMPARE
Bahamian
Pakistani
Vision Disability
Vision Disability Comparison
Bahamians
Pakistanis
2.4%
VISION DISABILITY
0.0/ 100
METRIC RATING
277th/ 347
METRIC RANK
2.1%
VISION DISABILITY
71.6/ 100
METRIC RATING
156th/ 347
METRIC RANK
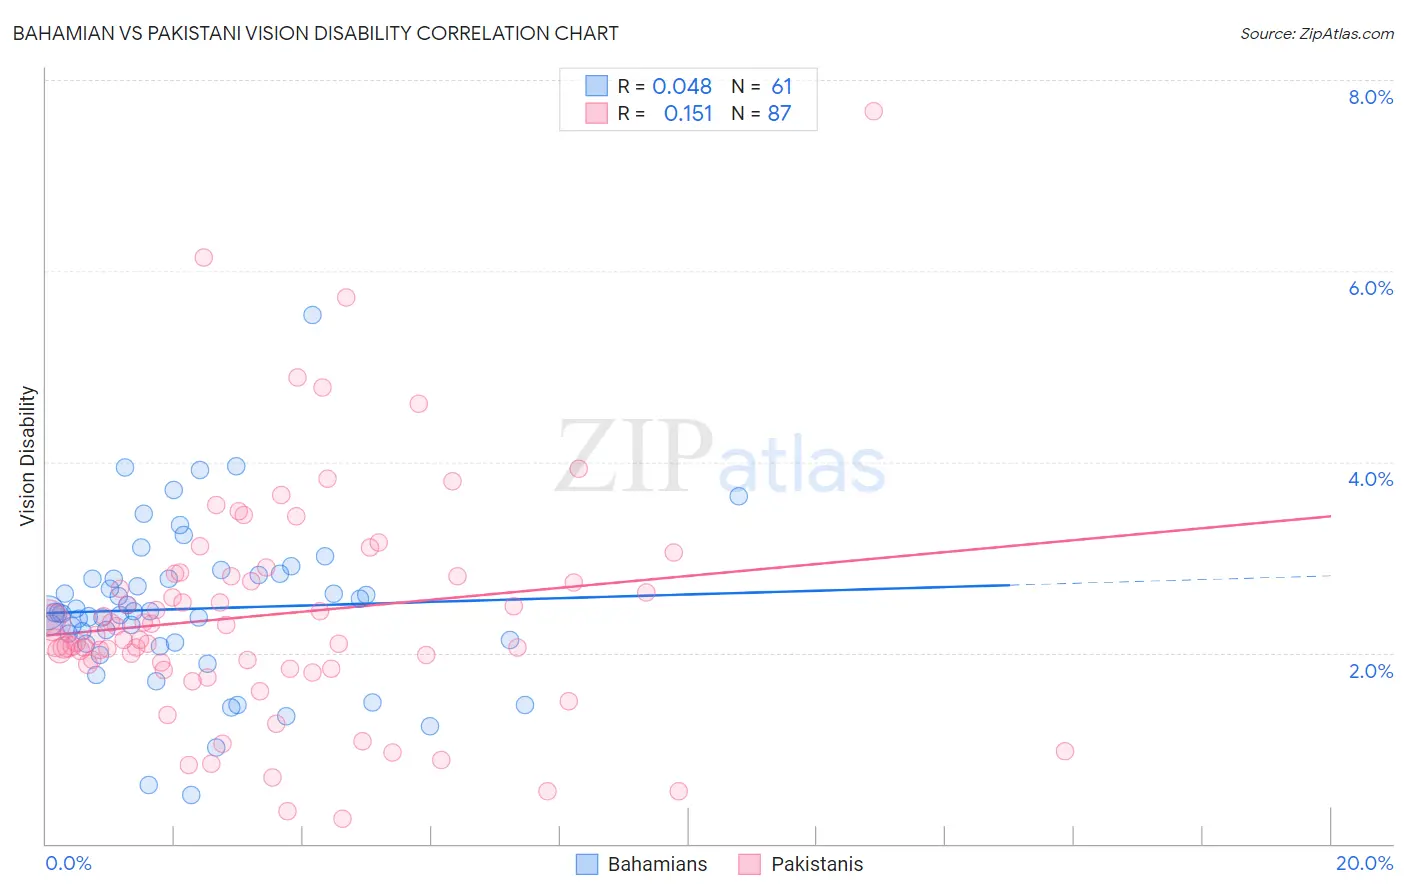
Bahamian vs Pakistani Vision Disability Correlation Chart
The statistical analysis conducted on geographies consisting of 112,669,490 people shows no correlation between the proportion of Bahamians and percentage of population with vision disability in the United States with a correlation coefficient (R) of 0.048 and weighted average of 2.4%. Similarly, the statistical analysis conducted on geographies consisting of 335,131,498 people shows a poor positive correlation between the proportion of Pakistanis and percentage of population with vision disability in the United States with a correlation coefficient (R) of 0.151 and weighted average of 2.1%, a difference of 14.3%.
Vision Disability Correlation Summary
| Measurement | Bahamian | Pakistani |
| Minimum | 0.51% | 0.26% |
| Maximum | 5.5% | 7.7% |
| Range | 5.0% | 7.4% |
| Mean | 2.5% | 2.4% |
| Median | 2.4% | 2.1% |
| Interquartile 25% (IQ1) | 2.1% | 1.8% |
| Interquartile 75% (IQ3) | 2.8% | 2.8% |
| Interquartile Range (IQR) | 0.69% | 0.96% |
| Standard Deviation (Sample) | 0.83% | 1.2% |
| Standard Deviation (Population) | 0.83% | 1.2% |
Similar Demographics by Vision Disability
Demographics Similar to Bahamians by Vision Disability
In terms of vision disability, the demographic groups most similar to Bahamians are Scotch-Irish (2.4%, a difference of 0.040%), Chippewa (2.4%, a difference of 0.13%), Spanish (2.4%, a difference of 0.16%), Nepalese (2.4%, a difference of 0.17%), and Cape Verdean (2.4%, a difference of 0.21%).
| Demographics | Rating | Rank | Vision Disability |
| Cubans | 0.1 /100 | #270 | Tragic 2.4% |
| Immigrants | Azores | 0.1 /100 | #271 | Tragic 2.4% |
| Spaniards | 0.1 /100 | #272 | Tragic 2.4% |
| Immigrants | Bahamas | 0.1 /100 | #273 | Tragic 2.4% |
| Immigrants | Latin America | 0.0 /100 | #274 | Tragic 2.4% |
| Chippewa | 0.0 /100 | #275 | Tragic 2.4% |
| Scotch-Irish | 0.0 /100 | #276 | Tragic 2.4% |
| Bahamians | 0.0 /100 | #277 | Tragic 2.4% |
| Spanish | 0.0 /100 | #278 | Tragic 2.4% |
| Nepalese | 0.0 /100 | #279 | Tragic 2.4% |
| Cape Verdeans | 0.0 /100 | #280 | Tragic 2.4% |
| U.S. Virgin Islanders | 0.0 /100 | #281 | Tragic 2.5% |
| Immigrants | Caribbean | 0.0 /100 | #282 | Tragic 2.5% |
| Puget Sound Salish | 0.0 /100 | #283 | Tragic 2.5% |
| Yakama | 0.0 /100 | #284 | Tragic 2.5% |
Demographics Similar to Pakistanis by Vision Disability
In terms of vision disability, the demographic groups most similar to Pakistanis are Immigrants from Colombia (2.1%, a difference of 0.040%), Serbian (2.1%, a difference of 0.11%), Immigrants from Uzbekistan (2.1%, a difference of 0.13%), South African (2.1%, a difference of 0.14%), and Slovene (2.1%, a difference of 0.16%).
| Demographics | Rating | Rank | Vision Disability |
| Colombians | 76.2 /100 | #149 | Good 2.1% |
| Belgians | 75.9 /100 | #150 | Good 2.1% |
| Immigrants | Norway | 75.5 /100 | #151 | Good 2.1% |
| Immigrants | Southern Europe | 74.6 /100 | #152 | Good 2.1% |
| Immigrants | South America | 73.8 /100 | #153 | Good 2.1% |
| Slovenes | 73.6 /100 | #154 | Good 2.1% |
| Immigrants | Colombia | 72.1 /100 | #155 | Good 2.1% |
| Pakistanis | 71.6 /100 | #156 | Good 2.1% |
| Serbians | 70.2 /100 | #157 | Good 2.1% |
| Immigrants | Uzbekistan | 69.9 /100 | #158 | Good 2.1% |
| South Africans | 69.8 /100 | #159 | Good 2.1% |
| Austrians | 69.0 /100 | #160 | Good 2.1% |
| Iraqis | 67.7 /100 | #161 | Good 2.1% |
| Hungarians | 67.4 /100 | #162 | Good 2.1% |
| Icelanders | 66.1 /100 | #163 | Good 2.1% |