Liberian vs Immigrants from Korea Female Disability
COMPARE
Liberian
Immigrants from Korea
Female Disability
Female Disability Comparison
Liberians
Immigrants from Korea
12.7%
FEMALE DISABILITY
1.1/ 100
METRIC RATING
257th/ 347
METRIC RANK
10.6%
FEMALE DISABILITY
100.0/ 100
METRIC RATING
11th/ 347
METRIC RANK
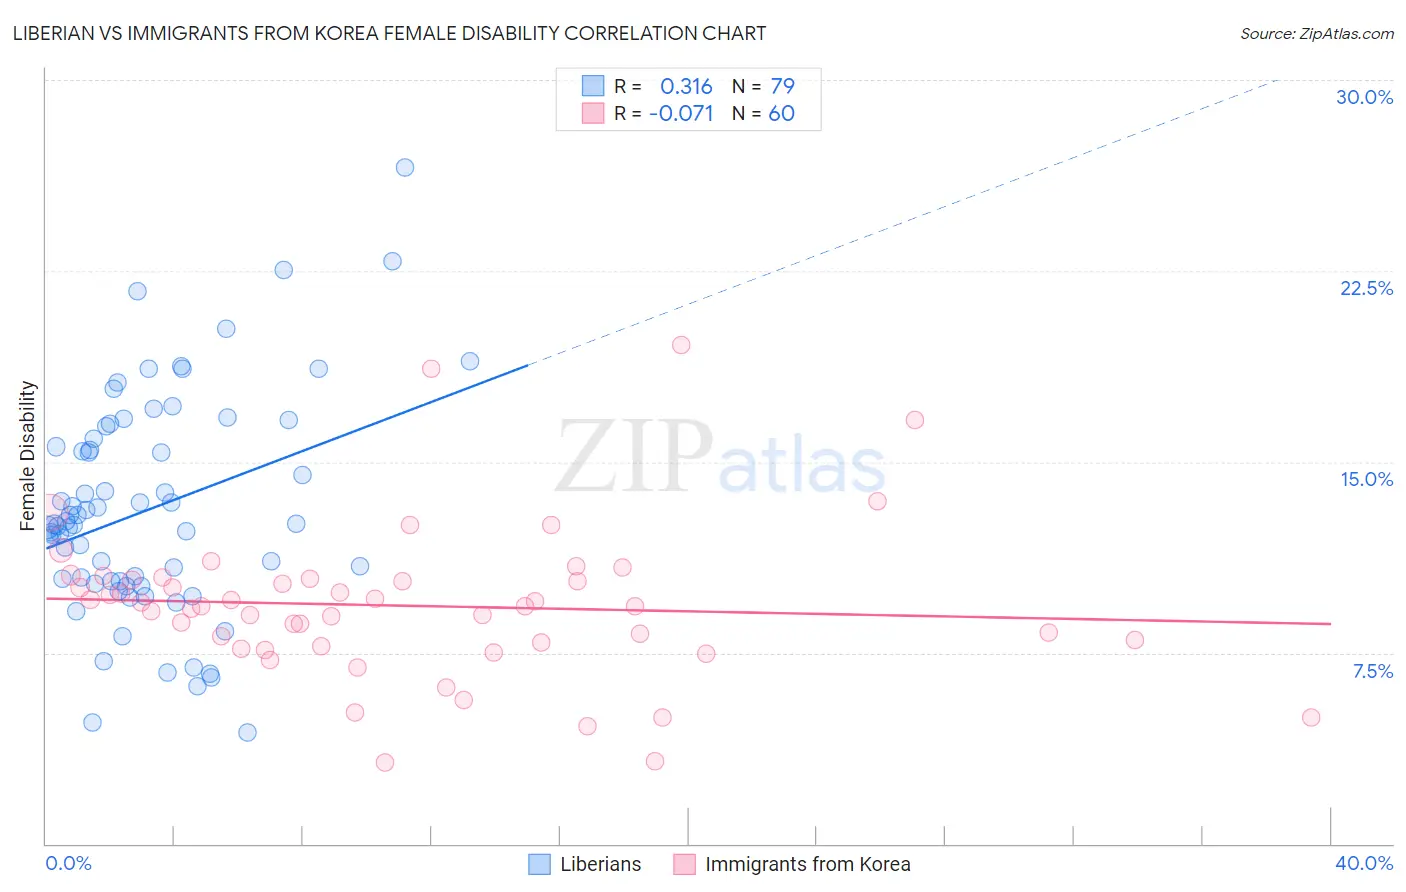
Liberian vs Immigrants from Korea Female Disability Correlation Chart
The statistical analysis conducted on geographies consisting of 118,083,063 people shows a mild positive correlation between the proportion of Liberians and percentage of females with a disability in the United States with a correlation coefficient (R) of 0.316 and weighted average of 12.7%. Similarly, the statistical analysis conducted on geographies consisting of 416,288,361 people shows a slight negative correlation between the proportion of Immigrants from Korea and percentage of females with a disability in the United States with a correlation coefficient (R) of -0.071 and weighted average of 10.6%, a difference of 19.5%.
Female Disability Correlation Summary
| Measurement | Liberian | Immigrants from Korea |
| Minimum | 4.4% | 3.2% |
| Maximum | 26.5% | 19.6% |
| Range | 22.2% | 16.4% |
| Mean | 13.1% | 9.4% |
| Median | 12.5% | 9.3% |
| Interquartile 25% (IQ1) | 10.3% | 7.8% |
| Interquartile 75% (IQ3) | 15.9% | 10.4% |
| Interquartile Range (IQR) | 5.6% | 2.6% |
| Standard Deviation (Sample) | 4.3% | 3.0% |
| Standard Deviation (Population) | 4.3% | 3.0% |
Similar Demographics by Female Disability
Demographics Similar to Liberians by Female Disability
In terms of female disability, the demographic groups most similar to Liberians are Aleut (12.7%, a difference of 0.0%), British West Indian (12.7%, a difference of 0.030%), Immigrants from Armenia (12.7%, a difference of 0.080%), Immigrants from Germany (12.7%, a difference of 0.10%), and Subsaharan African (12.7%, a difference of 0.10%).
| Demographics | Rating | Rank | Female Disability |
| Slovenes | 1.7 /100 | #250 | Tragic 12.7% |
| Crow | 1.6 /100 | #251 | Tragic 12.7% |
| Immigrants | Caribbean | 1.4 /100 | #252 | Tragic 12.7% |
| Jamaicans | 1.4 /100 | #253 | Tragic 12.7% |
| Hawaiians | 1.4 /100 | #254 | Tragic 12.7% |
| Immigrants | Germany | 1.3 /100 | #255 | Tragic 12.7% |
| British West Indians | 1.2 /100 | #256 | Tragic 12.7% |
| Liberians | 1.1 /100 | #257 | Tragic 12.7% |
| Aleuts | 1.1 /100 | #258 | Tragic 12.7% |
| Immigrants | Armenia | 1.0 /100 | #259 | Tragic 12.7% |
| Sub-Saharan Africans | 1.0 /100 | #260 | Tragic 12.7% |
| Bermudans | 1.0 /100 | #261 | Tragic 12.7% |
| Czechoslovakians | 0.9 /100 | #262 | Tragic 12.7% |
| Spaniards | 0.7 /100 | #263 | Tragic 12.8% |
| Alaska Natives | 0.6 /100 | #264 | Tragic 12.8% |
Demographics Similar to Immigrants from Korea by Female Disability
In terms of female disability, the demographic groups most similar to Immigrants from Korea are Immigrants from Hong Kong (10.6%, a difference of 0.17%), Immigrants from Israel (10.7%, a difference of 0.42%), Immigrants from Eastern Asia (10.7%, a difference of 0.49%), Immigrants from China (10.7%, a difference of 0.52%), and Iranian (10.6%, a difference of 0.82%).
| Demographics | Rating | Rank | Female Disability |
| Thais | 100.0 /100 | #4 | Exceptional 10.2% |
| Immigrants | Bolivia | 100.0 /100 | #5 | Exceptional 10.3% |
| Bolivians | 100.0 /100 | #6 | Exceptional 10.4% |
| Immigrants | Singapore | 100.0 /100 | #7 | Exceptional 10.4% |
| Immigrants | South Central Asia | 100.0 /100 | #8 | Exceptional 10.5% |
| Iranians | 100.0 /100 | #9 | Exceptional 10.6% |
| Immigrants | Hong Kong | 100.0 /100 | #10 | Exceptional 10.6% |
| Immigrants | Korea | 100.0 /100 | #11 | Exceptional 10.6% |
| Immigrants | Israel | 100.0 /100 | #12 | Exceptional 10.7% |
| Immigrants | Eastern Asia | 100.0 /100 | #13 | Exceptional 10.7% |
| Immigrants | China | 100.0 /100 | #14 | Exceptional 10.7% |
| Burmese | 100.0 /100 | #15 | Exceptional 10.7% |
| Okinawans | 100.0 /100 | #16 | Exceptional 10.8% |
| Indians (Asian) | 100.0 /100 | #17 | Exceptional 10.8% |
| Immigrants | Iran | 100.0 /100 | #18 | Exceptional 10.8% |