Liberian vs Immigrants from Haiti Disability Age 35 to 64
COMPARE
Liberian
Immigrants from Haiti
Disability Age 35 to 64
Disability Age 35 to 64 Comparison
Liberians
Immigrants from Haiti
12.9%
DISABILITY AGE 35 TO 64
0.1/ 100
METRIC RATING
280th/ 347
METRIC RANK
11.1%
DISABILITY AGE 35 TO 64
63.8/ 100
METRIC RATING
166th/ 347
METRIC RANK
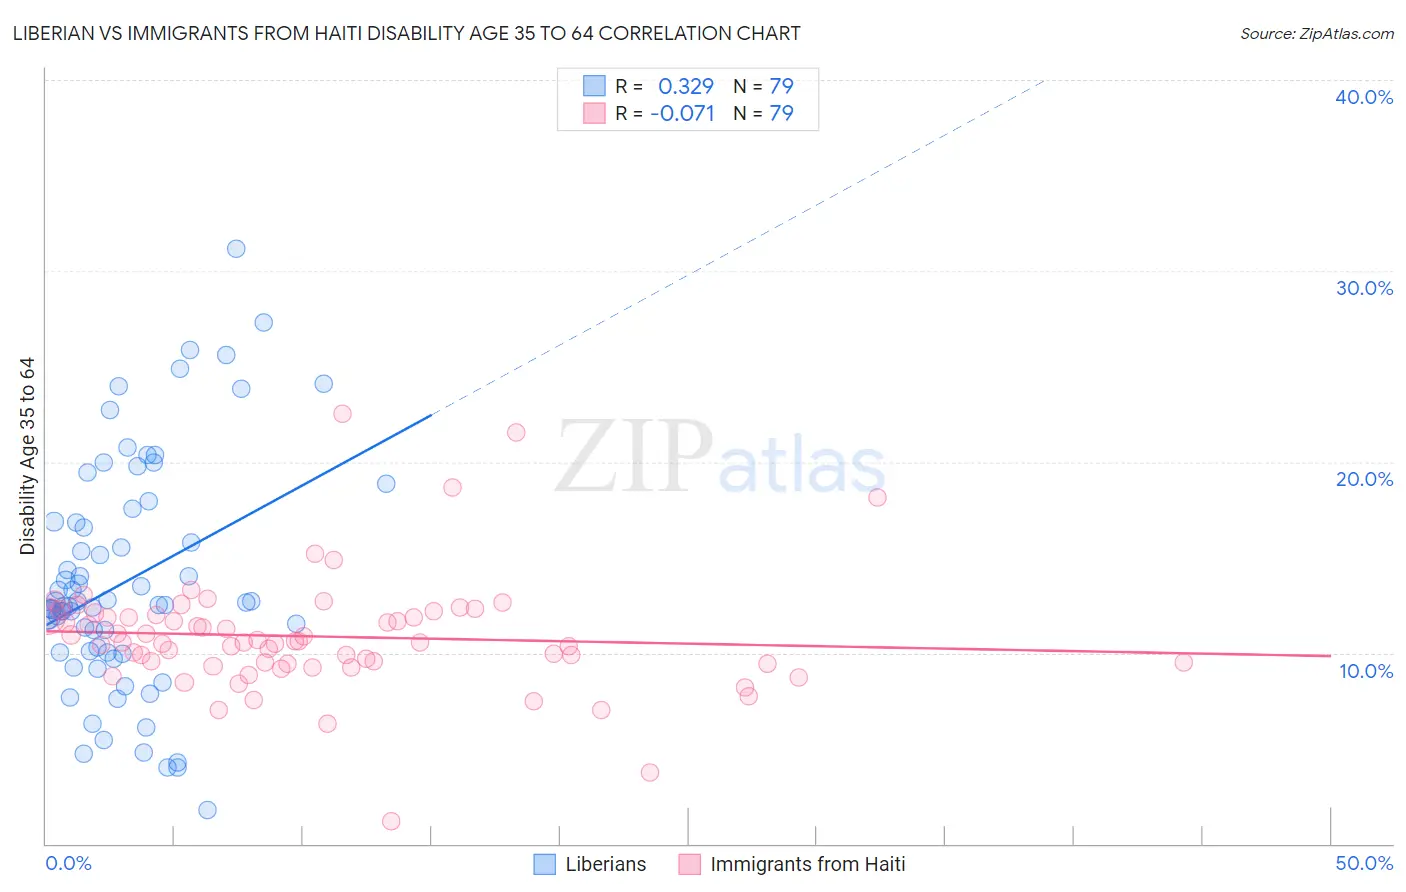
Liberian vs Immigrants from Haiti Disability Age 35 to 64 Correlation Chart
The statistical analysis conducted on geographies consisting of 118,034,378 people shows a mild positive correlation between the proportion of Liberians and percentage of population with a disability between the ages 34 and 64 in the United States with a correlation coefficient (R) of 0.329 and weighted average of 12.9%. Similarly, the statistical analysis conducted on geographies consisting of 225,154,899 people shows a slight negative correlation between the proportion of Immigrants from Haiti and percentage of population with a disability between the ages 34 and 64 in the United States with a correlation coefficient (R) of -0.071 and weighted average of 11.1%, a difference of 16.1%.
Disability Age 35 to 64 Correlation Summary
| Measurement | Liberian | Immigrants from Haiti |
| Minimum | 1.8% | 1.2% |
| Maximum | 31.1% | 22.5% |
| Range | 29.3% | 21.4% |
| Mean | 13.7% | 10.9% |
| Median | 12.5% | 10.6% |
| Interquartile 25% (IQ1) | 10.0% | 9.4% |
| Interquartile 75% (IQ3) | 16.9% | 12.0% |
| Interquartile Range (IQR) | 6.8% | 2.5% |
| Standard Deviation (Sample) | 6.0% | 3.1% |
| Standard Deviation (Population) | 5.9% | 3.1% |
Similar Demographics by Disability Age 35 to 64
Demographics Similar to Liberians by Disability Age 35 to 64
In terms of disability age 35 to 64, the demographic groups most similar to Liberians are Immigrants from Micronesia (12.9%, a difference of 0.17%), French Canadian (12.9%, a difference of 0.19%), Scotch-Irish (13.0%, a difference of 0.20%), Immigrants from Dominican Republic (12.9%, a difference of 0.22%), and Immigrants from Laos (13.0%, a difference of 0.29%).
| Demographics | Rating | Rank | Disability Age 35 to 64 |
| Pennsylvania Germans | 0.1 /100 | #273 | Tragic 12.8% |
| Celtics | 0.1 /100 | #274 | Tragic 12.9% |
| Dominicans | 0.1 /100 | #275 | Tragic 12.9% |
| Somalis | 0.1 /100 | #276 | Tragic 12.9% |
| Immigrants | Dominican Republic | 0.1 /100 | #277 | Tragic 12.9% |
| French Canadians | 0.1 /100 | #278 | Tragic 12.9% |
| Immigrants | Micronesia | 0.1 /100 | #279 | Tragic 12.9% |
| Liberians | 0.1 /100 | #280 | Tragic 12.9% |
| Scotch-Irish | 0.1 /100 | #281 | Tragic 13.0% |
| Immigrants | Laos | 0.1 /100 | #282 | Tragic 13.0% |
| Central American Indians | 0.0 /100 | #283 | Tragic 13.0% |
| Immigrants | Nonimmigrants | 0.0 /100 | #284 | Tragic 13.0% |
| Immigrants | Somalia | 0.0 /100 | #285 | Tragic 13.1% |
| Hmong | 0.0 /100 | #286 | Tragic 13.1% |
| Tlingit-Haida | 0.0 /100 | #287 | Tragic 13.2% |
Demographics Similar to Immigrants from Haiti by Disability Age 35 to 64
In terms of disability age 35 to 64, the demographic groups most similar to Immigrants from Haiti are Austrian (11.1%, a difference of 0.050%), Immigrants from Western Europe (11.1%, a difference of 0.12%), Pakistani (11.1%, a difference of 0.17%), Immigrants from St. Vincent and the Grenadines (11.1%, a difference of 0.25%), and Immigrants from Grenada (11.1%, a difference of 0.41%).
| Demographics | Rating | Rank | Disability Age 35 to 64 |
| Serbians | 73.6 /100 | #159 | Good 11.0% |
| Croatians | 73.1 /100 | #160 | Good 11.0% |
| Immigrants | Guyana | 70.1 /100 | #161 | Good 11.1% |
| Immigrants | Grenada | 68.4 /100 | #162 | Good 11.1% |
| Immigrants | St. Vincent and the Grenadines | 66.6 /100 | #163 | Good 11.1% |
| Pakistanis | 65.8 /100 | #164 | Good 11.1% |
| Immigrants | Western Europe | 65.2 /100 | #165 | Good 11.1% |
| Immigrants | Haiti | 63.8 /100 | #166 | Good 11.1% |
| Austrians | 63.2 /100 | #167 | Good 11.1% |
| Central Americans | 59.1 /100 | #168 | Average 11.2% |
| Haitians | 59.0 /100 | #169 | Average 11.2% |
| Immigrants | Uganda | 58.0 /100 | #170 | Average 11.2% |
| Immigrants | Trinidad and Tobago | 55.9 /100 | #171 | Average 11.2% |
| Italians | 55.6 /100 | #172 | Average 11.2% |
| Lebanese | 51.8 /100 | #173 | Average 11.3% |