Liberian vs Malaysian Disability Age 35 to 64
COMPARE
Liberian
Malaysian
Disability Age 35 to 64
Disability Age 35 to 64 Comparison
Liberians
Malaysians
12.9%
DISABILITY AGE 35 TO 64
0.1/ 100
METRIC RATING
280th/ 347
METRIC RANK
12.5%
DISABILITY AGE 35 TO 64
0.5/ 100
METRIC RATING
261st/ 347
METRIC RANK
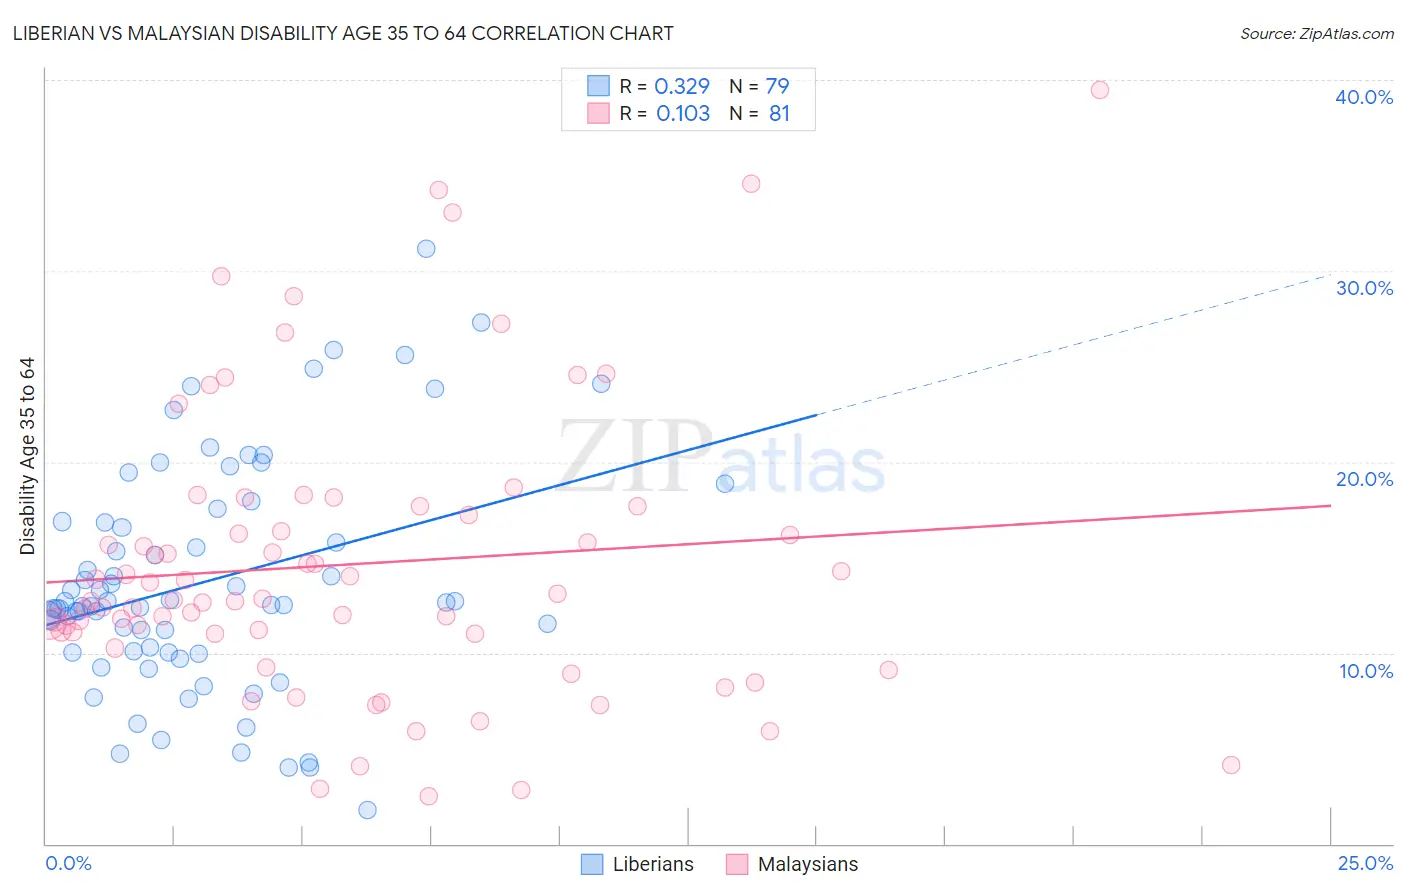
Liberian vs Malaysian Disability Age 35 to 64 Correlation Chart
The statistical analysis conducted on geographies consisting of 118,034,378 people shows a mild positive correlation between the proportion of Liberians and percentage of population with a disability between the ages 34 and 64 in the United States with a correlation coefficient (R) of 0.329 and weighted average of 12.9%. Similarly, the statistical analysis conducted on geographies consisting of 225,999,925 people shows a poor positive correlation between the proportion of Malaysians and percentage of population with a disability between the ages 34 and 64 in the United States with a correlation coefficient (R) of 0.103 and weighted average of 12.5%, a difference of 3.7%.
Disability Age 35 to 64 Correlation Summary
| Measurement | Liberian | Malaysian |
| Minimum | 1.8% | 2.5% |
| Maximum | 31.1% | 39.5% |
| Range | 29.3% | 37.0% |
| Mean | 13.7% | 14.6% |
| Median | 12.5% | 12.8% |
| Interquartile 25% (IQ1) | 10.0% | 11.0% |
| Interquartile 75% (IQ3) | 16.9% | 17.4% |
| Interquartile Range (IQR) | 6.8% | 6.5% |
| Standard Deviation (Sample) | 6.0% | 7.5% |
| Standard Deviation (Population) | 5.9% | 7.5% |
Demographics Similar to Liberians and Malaysians by Disability Age 35 to 64
In terms of disability age 35 to 64, the demographic groups most similar to Liberians are Immigrants from Micronesia (12.9%, a difference of 0.17%), French Canadian (12.9%, a difference of 0.19%), Immigrants from Dominican Republic (12.9%, a difference of 0.22%), Somali (12.9%, a difference of 0.42%), and Dominican (12.9%, a difference of 0.54%). Similarly, the demographic groups most similar to Malaysians are Senegalese (12.5%, a difference of 0.080%), German Russian (12.5%, a difference of 0.15%), Immigrants from Zaire (12.5%, a difference of 0.33%), Immigrants from Portugal (12.5%, a difference of 0.34%), and Marshallese (12.5%, a difference of 0.45%).
| Demographics | Rating | Rank | Disability Age 35 to 64 |
| German Russians | 0.5 /100 | #260 | Tragic 12.5% |
| Malaysians | 0.5 /100 | #261 | Tragic 12.5% |
| Senegalese | 0.5 /100 | #262 | Tragic 12.5% |
| Immigrants | Zaire | 0.4 /100 | #263 | Tragic 12.5% |
| Immigrants | Portugal | 0.4 /100 | #264 | Tragic 12.5% |
| Marshallese | 0.4 /100 | #265 | Tragic 12.5% |
| Whites/Caucasians | 0.3 /100 | #266 | Tragic 12.6% |
| Sub-Saharan Africans | 0.2 /100 | #267 | Tragic 12.6% |
| Immigrants | Dominica | 0.2 /100 | #268 | Tragic 12.7% |
| Spanish | 0.2 /100 | #269 | Tragic 12.7% |
| French | 0.2 /100 | #270 | Tragic 12.7% |
| Nepalese | 0.1 /100 | #271 | Tragic 12.8% |
| U.S. Virgin Islanders | 0.1 /100 | #272 | Tragic 12.8% |
| Pennsylvania Germans | 0.1 /100 | #273 | Tragic 12.8% |
| Celtics | 0.1 /100 | #274 | Tragic 12.9% |
| Dominicans | 0.1 /100 | #275 | Tragic 12.9% |
| Somalis | 0.1 /100 | #276 | Tragic 12.9% |
| Immigrants | Dominican Republic | 0.1 /100 | #277 | Tragic 12.9% |
| French Canadians | 0.1 /100 | #278 | Tragic 12.9% |
| Immigrants | Micronesia | 0.1 /100 | #279 | Tragic 12.9% |
| Liberians | 0.1 /100 | #280 | Tragic 12.9% |