Latvian vs Immigrants from North Macedonia Hearing Disability
COMPARE
Latvian
Immigrants from North Macedonia
Hearing Disability
Hearing Disability Comparison
Latvians
Immigrants from North Macedonia
3.2%
HEARING DISABILITY
5.1/ 100
METRIC RATING
225th/ 347
METRIC RANK
3.1%
HEARING DISABILITY
19.1/ 100
METRIC RATING
200th/ 347
METRIC RANK
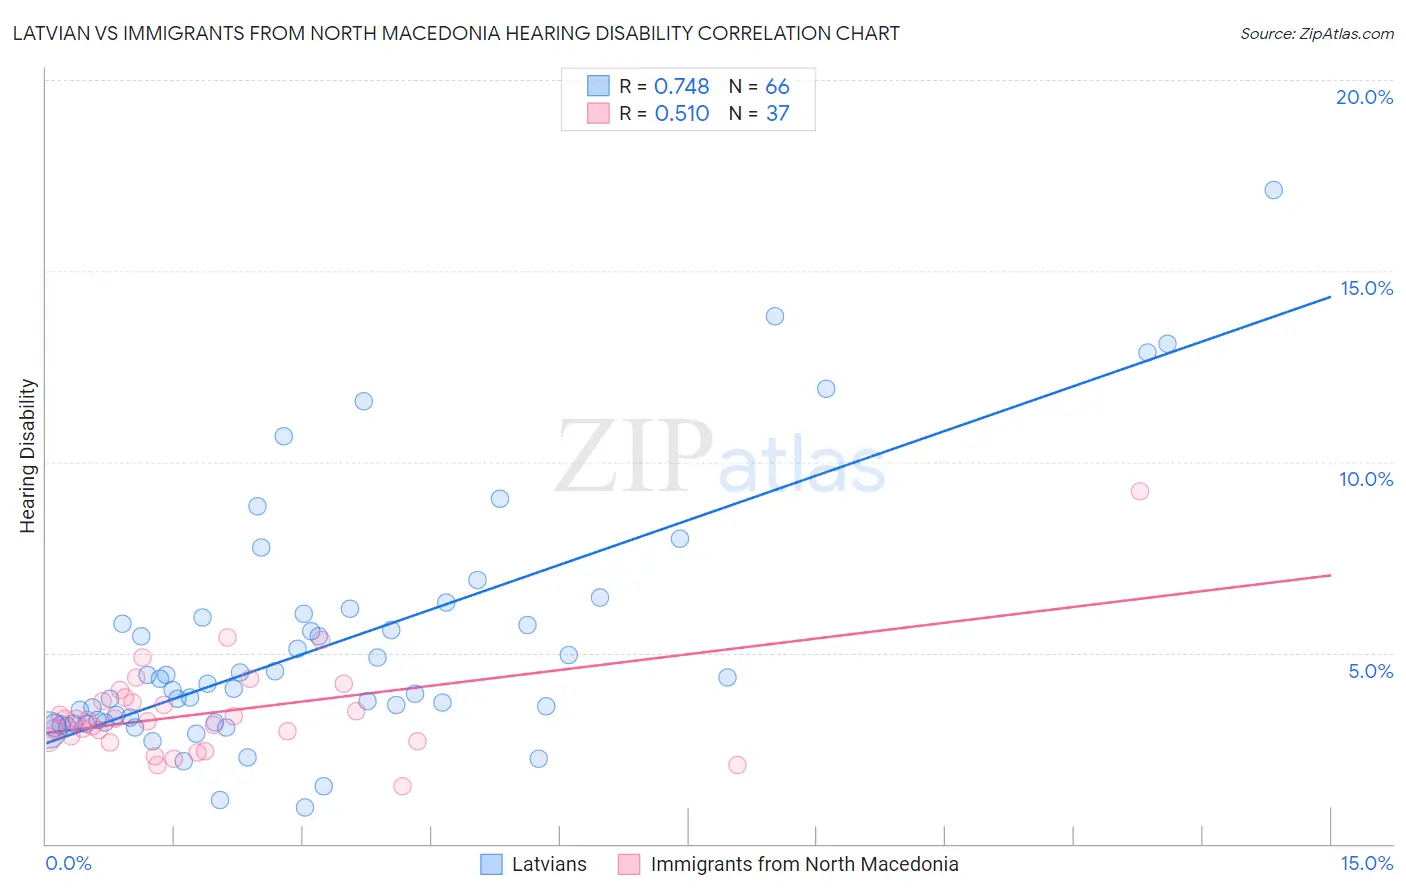
Latvian vs Immigrants from North Macedonia Hearing Disability Correlation Chart
The statistical analysis conducted on geographies consisting of 220,695,390 people shows a strong positive correlation between the proportion of Latvians and percentage of population with hearing disability in the United States with a correlation coefficient (R) of 0.748 and weighted average of 3.2%. Similarly, the statistical analysis conducted on geographies consisting of 74,314,151 people shows a substantial positive correlation between the proportion of Immigrants from North Macedonia and percentage of population with hearing disability in the United States with a correlation coefficient (R) of 0.510 and weighted average of 3.1%, a difference of 3.4%.
Hearing Disability Correlation Summary
| Measurement | Latvian | Immigrants from North Macedonia |
| Minimum | 0.95% | 1.5% |
| Maximum | 17.1% | 9.2% |
| Range | 16.2% | 7.7% |
| Mean | 5.2% | 3.4% |
| Median | 4.1% | 3.2% |
| Interquartile 25% (IQ1) | 3.2% | 2.7% |
| Interquartile 75% (IQ3) | 5.9% | 3.8% |
| Interquartile Range (IQR) | 2.8% | 1.1% |
| Standard Deviation (Sample) | 3.2% | 1.3% |
| Standard Deviation (Population) | 3.2% | 1.3% |
Similar Demographics by Hearing Disability
Demographics Similar to Latvians by Hearing Disability
In terms of hearing disability, the demographic groups most similar to Latvians are Icelander (3.2%, a difference of 0.040%), Lebanese (3.2%, a difference of 0.040%), Mexican (3.2%, a difference of 0.21%), Bhutanese (3.2%, a difference of 0.23%), and Immigrants from Portugal (3.2%, a difference of 0.42%).
| Demographics | Rating | Rank | Hearing Disability |
| Immigrants | Northern Europe | 7.0 /100 | #218 | Tragic 3.2% |
| New Zealanders | 6.8 /100 | #219 | Tragic 3.2% |
| Malaysians | 6.6 /100 | #220 | Tragic 3.2% |
| Immigrants | Laos | 6.6 /100 | #221 | Tragic 3.2% |
| Immigrants | Oceania | 6.5 /100 | #222 | Tragic 3.2% |
| Mexicans | 5.6 /100 | #223 | Tragic 3.2% |
| Icelanders | 5.2 /100 | #224 | Tragic 3.2% |
| Latvians | 5.1 /100 | #225 | Tragic 3.2% |
| Lebanese | 5.0 /100 | #226 | Tragic 3.2% |
| Bhutanese | 4.6 /100 | #227 | Tragic 3.2% |
| Immigrants | Portugal | 4.3 /100 | #228 | Tragic 3.2% |
| Maltese | 4.1 /100 | #229 | Tragic 3.2% |
| Greeks | 3.2 /100 | #230 | Tragic 3.2% |
| Luxembourgers | 2.9 /100 | #231 | Tragic 3.2% |
| Ukrainians | 2.9 /100 | #232 | Tragic 3.2% |
Demographics Similar to Immigrants from North Macedonia by Hearing Disability
In terms of hearing disability, the demographic groups most similar to Immigrants from North Macedonia are Syrian (3.1%, a difference of 0.010%), Iraqi (3.1%, a difference of 0.020%), Immigrants from Croatia (3.1%, a difference of 0.19%), Immigrants from Bosnia and Herzegovina (3.1%, a difference of 0.21%), and Immigrants from Thailand (3.1%, a difference of 0.42%).
| Demographics | Rating | Rank | Hearing Disability |
| Macedonians | 27.0 /100 | #193 | Fair 3.1% |
| South Africans | 24.5 /100 | #194 | Fair 3.1% |
| Spanish American Indians | 24.1 /100 | #195 | Fair 3.1% |
| Immigrants | Europe | 22.9 /100 | #196 | Fair 3.1% |
| Immigrants | Bosnia and Herzegovina | 20.6 /100 | #197 | Fair 3.1% |
| Immigrants | Croatia | 20.5 /100 | #198 | Fair 3.1% |
| Syrians | 19.2 /100 | #199 | Poor 3.1% |
| Immigrants | North Macedonia | 19.1 /100 | #200 | Poor 3.1% |
| Iraqis | 19.0 /100 | #201 | Poor 3.1% |
| Immigrants | Thailand | 16.4 /100 | #202 | Poor 3.1% |
| Immigrants | Denmark | 16.2 /100 | #203 | Poor 3.1% |
| Immigrants | Czechoslovakia | 15.9 /100 | #204 | Poor 3.1% |
| Alsatians | 15.9 /100 | #205 | Poor 3.1% |
| Eastern Europeans | 15.5 /100 | #206 | Poor 3.1% |
| Hispanics or Latinos | 15.1 /100 | #207 | Poor 3.1% |