Korean vs Immigrants from Burma/Myanmar Cognitive Disability
COMPARE
Korean
Immigrants from Burma/Myanmar
Cognitive Disability
Cognitive Disability Comparison
Koreans
Immigrants from Burma/Myanmar
16.8%
COGNITIVE DISABILITY
97.1/ 100
METRIC RATING
114th/ 347
METRIC RANK
18.2%
COGNITIVE DISABILITY
0.0/ 100
METRIC RATING
296th/ 347
METRIC RANK
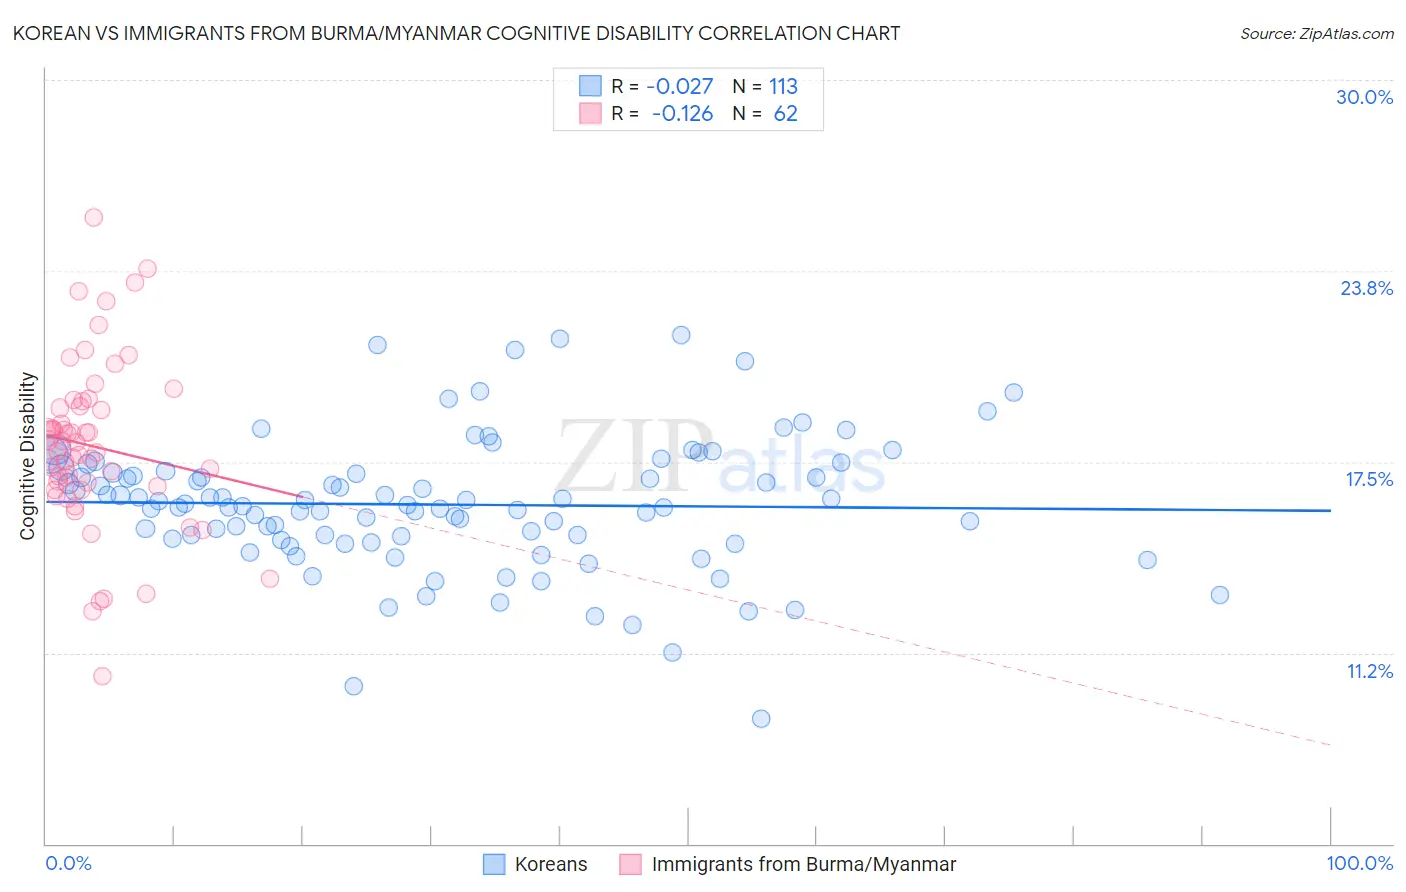
Korean vs Immigrants from Burma/Myanmar Cognitive Disability Correlation Chart
The statistical analysis conducted on geographies consisting of 510,841,440 people shows no correlation between the proportion of Koreans and percentage of population with cognitive disability in the United States with a correlation coefficient (R) of -0.027 and weighted average of 16.8%. Similarly, the statistical analysis conducted on geographies consisting of 172,345,235 people shows a poor negative correlation between the proportion of Immigrants from Burma/Myanmar and percentage of population with cognitive disability in the United States with a correlation coefficient (R) of -0.126 and weighted average of 18.2%, a difference of 8.2%.
Cognitive Disability Correlation Summary
| Measurement | Korean | Immigrants from Burma/Myanmar |
| Minimum | 9.1% | 10.5% |
| Maximum | 21.7% | 25.5% |
| Range | 12.6% | 15.0% |
| Mean | 16.1% | 18.0% |
| Median | 16.1% | 18.0% |
| Interquartile 25% (IQ1) | 15.0% | 16.7% |
| Interquartile 75% (IQ3) | 17.2% | 19.3% |
| Interquartile Range (IQR) | 2.2% | 2.6% |
| Standard Deviation (Sample) | 2.2% | 2.8% |
| Standard Deviation (Population) | 2.2% | 2.7% |
Similar Demographics by Cognitive Disability
Demographics Similar to Koreans by Cognitive Disability
In terms of cognitive disability, the demographic groups most similar to Koreans are Immigrants from Sri Lanka (16.8%, a difference of 0.0%), Indian (Asian) (16.8%, a difference of 0.010%), Uruguayan (16.8%, a difference of 0.030%), Arapaho (16.8%, a difference of 0.040%), and Albanian (16.8%, a difference of 0.050%).
| Demographics | Rating | Rank | Cognitive Disability |
| Immigrants | Nicaragua | 97.8 /100 | #107 | Exceptional 16.8% |
| Canadians | 97.5 /100 | #108 | Exceptional 16.8% |
| Albanians | 97.3 /100 | #109 | Exceptional 16.8% |
| Arapaho | 97.3 /100 | #110 | Exceptional 16.8% |
| Uruguayans | 97.2 /100 | #111 | Exceptional 16.8% |
| Indians (Asian) | 97.2 /100 | #112 | Exceptional 16.8% |
| Immigrants | Sri Lanka | 97.1 /100 | #113 | Exceptional 16.8% |
| Koreans | 97.1 /100 | #114 | Exceptional 16.8% |
| Yup'ik | 96.9 /100 | #115 | Exceptional 16.9% |
| Inupiat | 96.5 /100 | #116 | Exceptional 16.9% |
| Immigrants | Japan | 96.2 /100 | #117 | Exceptional 16.9% |
| Immigrants | Denmark | 96.2 /100 | #118 | Exceptional 16.9% |
| South Africans | 95.5 /100 | #119 | Exceptional 16.9% |
| Scottish | 95.0 /100 | #120 | Exceptional 16.9% |
| Immigrants | China | 94.9 /100 | #121 | Exceptional 16.9% |
Demographics Similar to Immigrants from Burma/Myanmar by Cognitive Disability
In terms of cognitive disability, the demographic groups most similar to Immigrants from Burma/Myanmar are German Russian (18.2%, a difference of 0.020%), Blackfeet (18.3%, a difference of 0.14%), Japanese (18.3%, a difference of 0.14%), Ghanaian (18.3%, a difference of 0.18%), and British West Indian (18.2%, a difference of 0.20%).
| Demographics | Rating | Rank | Cognitive Disability |
| Natives/Alaskans | 0.1 /100 | #289 | Tragic 18.1% |
| Immigrants | Africa | 0.1 /100 | #290 | Tragic 18.1% |
| Ottawa | 0.1 /100 | #291 | Tragic 18.2% |
| Iroquois | 0.1 /100 | #292 | Tragic 18.2% |
| Central American Indians | 0.1 /100 | #293 | Tragic 18.2% |
| British West Indians | 0.1 /100 | #294 | Tragic 18.2% |
| German Russians | 0.0 /100 | #295 | Tragic 18.2% |
| Immigrants | Burma/Myanmar | 0.0 /100 | #296 | Tragic 18.2% |
| Blackfeet | 0.0 /100 | #297 | Tragic 18.3% |
| Japanese | 0.0 /100 | #298 | Tragic 18.3% |
| Ghanaians | 0.0 /100 | #299 | Tragic 18.3% |
| Creek | 0.0 /100 | #300 | Tragic 18.3% |
| Immigrants | Ghana | 0.0 /100 | #301 | Tragic 18.3% |
| Barbadians | 0.0 /100 | #302 | Tragic 18.3% |
| Immigrants | Kenya | 0.0 /100 | #303 | Tragic 18.3% |