Kiowa vs Navajo Disability Age 65 to 74
COMPARE
Kiowa
Navajo
Disability Age 65 to 74
Disability Age 65 to 74 Comparison
Kiowa
Navajo
32.6%
DISABILITY AGE 65 TO 74
0.0/ 100
METRIC RATING
339th/ 347
METRIC RANK
33.3%
DISABILITY AGE 65 TO 74
0.0/ 100
METRIC RATING
343rd/ 347
METRIC RANK
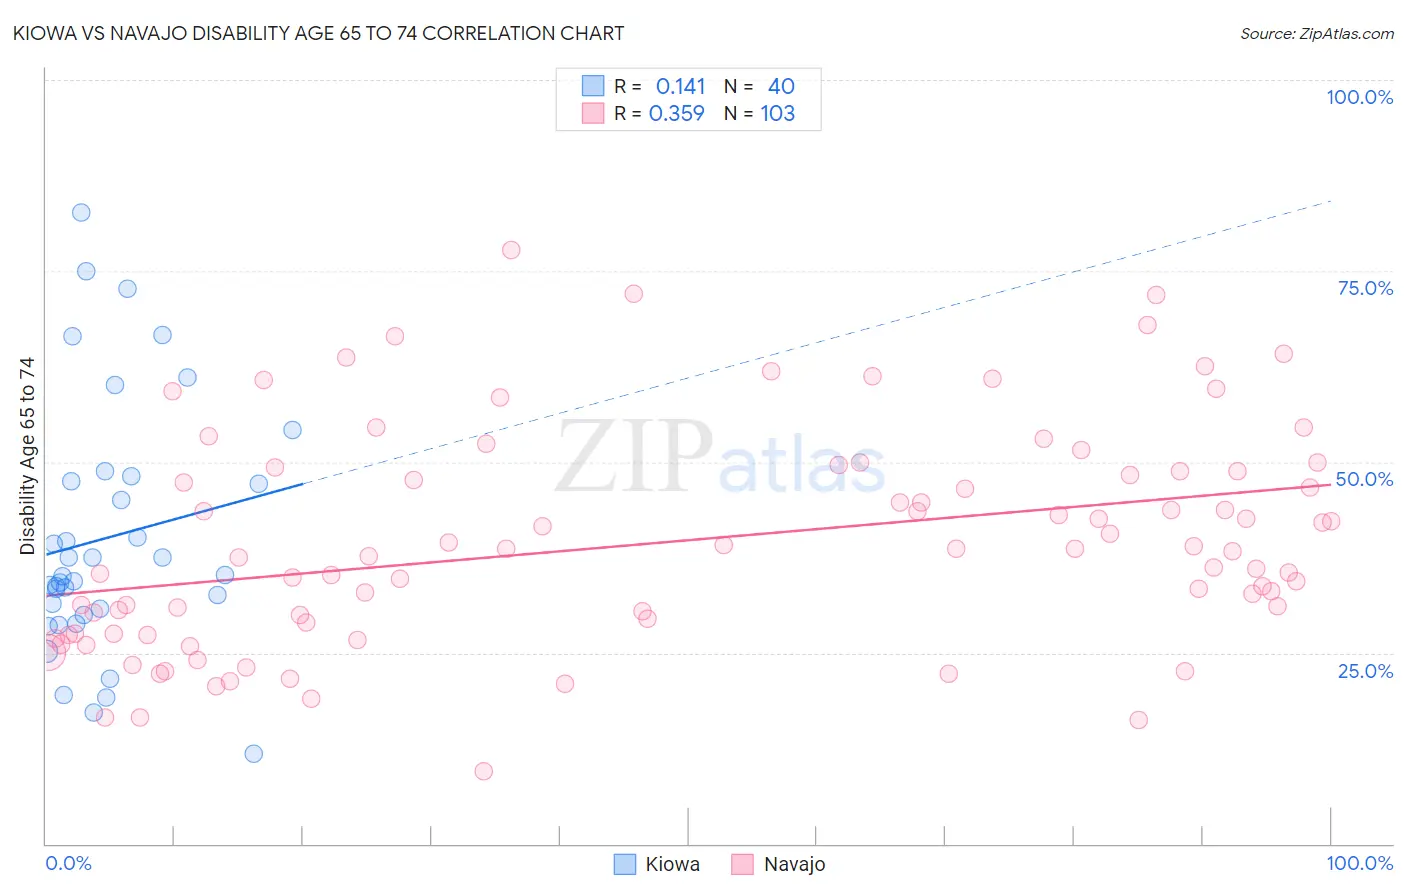
Kiowa vs Navajo Disability Age 65 to 74 Correlation Chart
The statistical analysis conducted on geographies consisting of 56,067,785 people shows a poor positive correlation between the proportion of Kiowa and percentage of population with a disability between the ages 65 and 75 in the United States with a correlation coefficient (R) of 0.141 and weighted average of 32.6%. Similarly, the statistical analysis conducted on geographies consisting of 224,352,608 people shows a mild positive correlation between the proportion of Navajo and percentage of population with a disability between the ages 65 and 75 in the United States with a correlation coefficient (R) of 0.359 and weighted average of 33.3%, a difference of 2.4%.
Disability Age 65 to 74 Correlation Summary
| Measurement | Kiowa | Navajo |
| Minimum | 11.7% | 9.5% |
| Maximum | 82.6% | 77.8% |
| Range | 70.9% | 68.3% |
| Mean | 40.1% | 39.5% |
| Median | 35.1% | 38.2% |
| Interquartile 25% (IQ1) | 30.3% | 27.6% |
| Interquartile 75% (IQ3) | 47.7% | 48.8% |
| Interquartile Range (IQR) | 17.4% | 21.2% |
| Standard Deviation (Sample) | 16.5% | 14.4% |
| Standard Deviation (Population) | 16.3% | 14.3% |
Demographics Similar to Kiowa and Navajo by Disability Age 65 to 74
In terms of disability age 65 to 74, the demographic groups most similar to Kiowa are Lumbee (32.7%, a difference of 0.52%), Alaskan Athabascan (32.4%, a difference of 0.62%), Houma (32.3%, a difference of 0.81%), Tsimshian (32.9%, a difference of 1.1%), and Pueblo (33.1%, a difference of 1.7%). Similarly, the demographic groups most similar to Navajo are Pueblo (33.1%, a difference of 0.72%), Tsimshian (32.9%, a difference of 1.3%), Lumbee (32.7%, a difference of 1.9%), Alaskan Athabascan (32.4%, a difference of 3.0%), and Houma (32.3%, a difference of 3.2%).
| Demographics | Rating | Rank | Disability Age 65 to 74 |
| Hopi | 0.0 /100 | #328 | Tragic 30.0% |
| Choctaw | 0.0 /100 | #329 | Tragic 30.2% |
| Creek | 0.0 /100 | #330 | Tragic 30.2% |
| Chickasaw | 0.0 /100 | #331 | Tragic 30.2% |
| Natives/Alaskans | 0.0 /100 | #332 | Tragic 30.4% |
| Colville | 0.0 /100 | #333 | Tragic 30.5% |
| Alaska Natives | 0.0 /100 | #334 | Tragic 30.6% |
| Cheyenne | 0.0 /100 | #335 | Tragic 31.1% |
| Yuman | 0.0 /100 | #336 | Tragic 31.5% |
| Houma | 0.0 /100 | #337 | Tragic 32.3% |
| Alaskan Athabascans | 0.0 /100 | #338 | Tragic 32.4% |
| Kiowa | 0.0 /100 | #339 | Tragic 32.6% |
| Lumbee | 0.0 /100 | #340 | Tragic 32.7% |
| Tsimshian | 0.0 /100 | #341 | Tragic 32.9% |
| Pueblo | 0.0 /100 | #342 | Tragic 33.1% |
| Navajo | 0.0 /100 | #343 | Tragic 33.3% |
| Inupiat | 0.0 /100 | #344 | Tragic 34.5% |
| Tohono O'odham | 0.0 /100 | #345 | Tragic 36.0% |
| Yup'ik | 0.0 /100 | #346 | Tragic 37.8% |
| Pima | 0.0 /100 | #347 | Tragic 38.6% |