Japanese vs Navajo Disability Age 65 to 74
COMPARE
Japanese
Navajo
Disability Age 65 to 74
Disability Age 65 to 74 Comparison
Japanese
Navajo
25.7%
DISABILITY AGE 65 TO 74
0.1/ 100
METRIC RATING
273rd/ 347
METRIC RANK
33.3%
DISABILITY AGE 65 TO 74
0.0/ 100
METRIC RATING
343rd/ 347
METRIC RANK
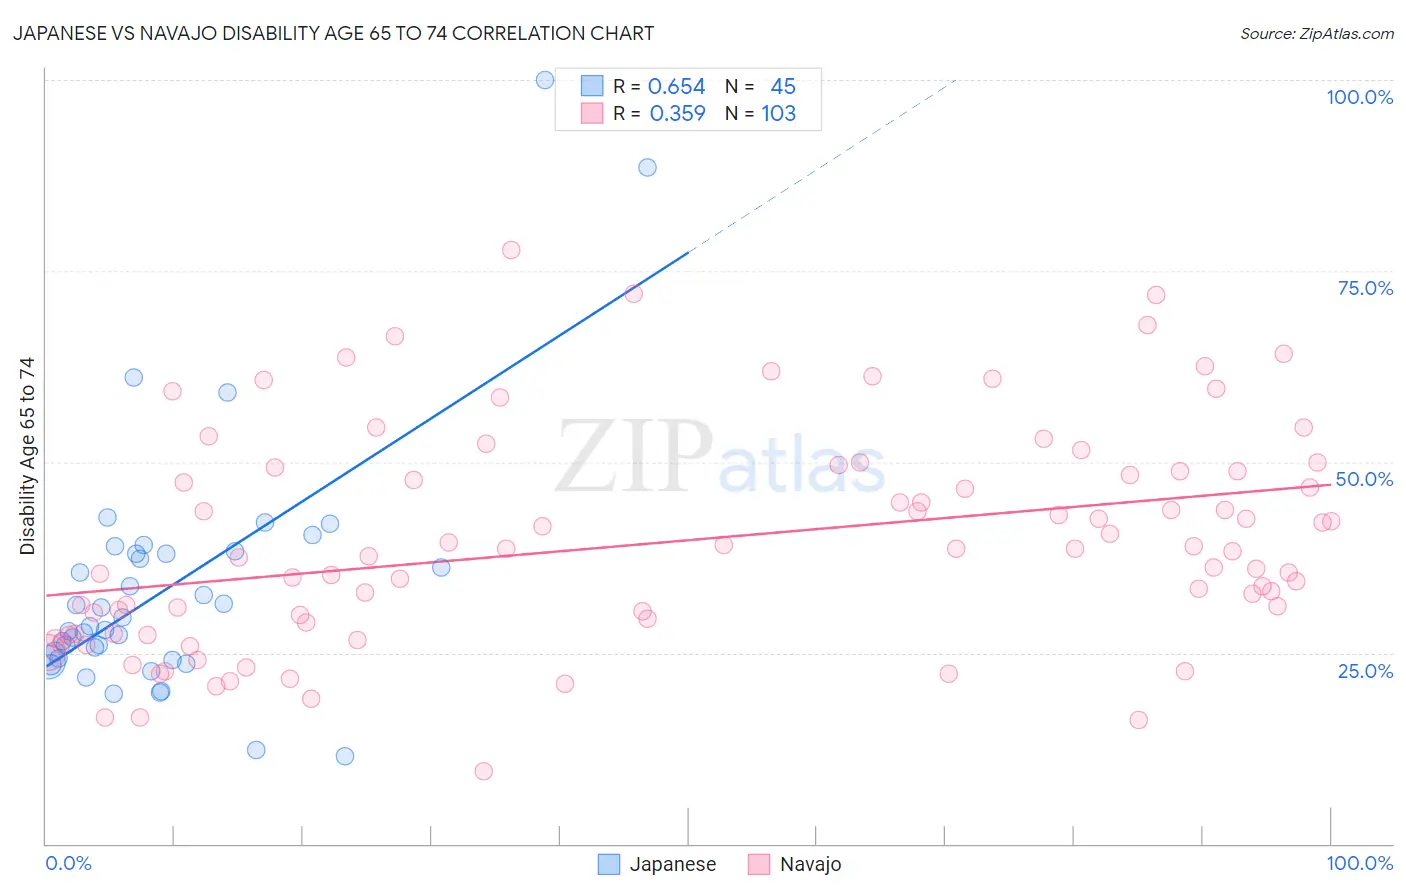
Japanese vs Navajo Disability Age 65 to 74 Correlation Chart
The statistical analysis conducted on geographies consisting of 248,828,802 people shows a significant positive correlation between the proportion of Japanese and percentage of population with a disability between the ages 65 and 75 in the United States with a correlation coefficient (R) of 0.654 and weighted average of 25.7%. Similarly, the statistical analysis conducted on geographies consisting of 224,352,608 people shows a mild positive correlation between the proportion of Navajo and percentage of population with a disability between the ages 65 and 75 in the United States with a correlation coefficient (R) of 0.359 and weighted average of 33.3%, a difference of 29.6%.
Disability Age 65 to 74 Correlation Summary
| Measurement | Japanese | Navajo |
| Minimum | 11.5% | 9.5% |
| Maximum | 100.0% | 77.8% |
| Range | 88.5% | 68.3% |
| Mean | 33.5% | 39.5% |
| Median | 28.5% | 38.2% |
| Interquartile 25% (IQ1) | 24.2% | 27.6% |
| Interquartile 75% (IQ3) | 38.1% | 48.8% |
| Interquartile Range (IQR) | 13.9% | 21.2% |
| Standard Deviation (Sample) | 16.5% | 14.4% |
| Standard Deviation (Population) | 16.4% | 14.3% |
Similar Demographics by Disability Age 65 to 74
Demographics Similar to Japanese by Disability Age 65 to 74
In terms of disability age 65 to 74, the demographic groups most similar to Japanese are Immigrants from Liberia (25.7%, a difference of 0.13%), Immigrants from Dominica (25.7%, a difference of 0.13%), Immigrants from Guatemala (25.7%, a difference of 0.16%), Hmong (25.7%, a difference of 0.24%), and American (25.8%, a difference of 0.33%).
| Demographics | Rating | Rank | Disability Age 65 to 74 |
| Immigrants | Latin America | 0.1 /100 | #266 | Tragic 25.6% |
| Ottawa | 0.1 /100 | #267 | Tragic 25.6% |
| Liberians | 0.1 /100 | #268 | Tragic 25.6% |
| Hmong | 0.1 /100 | #269 | Tragic 25.7% |
| Immigrants | Guatemala | 0.1 /100 | #270 | Tragic 25.7% |
| Immigrants | Liberia | 0.1 /100 | #271 | Tragic 25.7% |
| Immigrants | Dominica | 0.1 /100 | #272 | Tragic 25.7% |
| Japanese | 0.1 /100 | #273 | Tragic 25.7% |
| Americans | 0.1 /100 | #274 | Tragic 25.8% |
| Hondurans | 0.1 /100 | #275 | Tragic 25.8% |
| French American Indians | 0.1 /100 | #276 | Tragic 25.8% |
| Belizeans | 0.1 /100 | #277 | Tragic 25.8% |
| Immigrants | Belize | 0.1 /100 | #278 | Tragic 25.8% |
| U.S. Virgin Islanders | 0.1 /100 | #279 | Tragic 25.9% |
| Cree | 0.1 /100 | #280 | Tragic 25.9% |
Demographics Similar to Navajo by Disability Age 65 to 74
In terms of disability age 65 to 74, the demographic groups most similar to Navajo are Pueblo (33.1%, a difference of 0.72%), Tsimshian (32.9%, a difference of 1.3%), Lumbee (32.7%, a difference of 1.9%), Kiowa (32.6%, a difference of 2.4%), and Alaskan Athabascan (32.4%, a difference of 3.0%).
| Demographics | Rating | Rank | Disability Age 65 to 74 |
| Colville | 0.0 /100 | #333 | Tragic 30.5% |
| Alaska Natives | 0.0 /100 | #334 | Tragic 30.6% |
| Cheyenne | 0.0 /100 | #335 | Tragic 31.1% |
| Yuman | 0.0 /100 | #336 | Tragic 31.5% |
| Houma | 0.0 /100 | #337 | Tragic 32.3% |
| Alaskan Athabascans | 0.0 /100 | #338 | Tragic 32.4% |
| Kiowa | 0.0 /100 | #339 | Tragic 32.6% |
| Lumbee | 0.0 /100 | #340 | Tragic 32.7% |
| Tsimshian | 0.0 /100 | #341 | Tragic 32.9% |
| Pueblo | 0.0 /100 | #342 | Tragic 33.1% |
| Navajo | 0.0 /100 | #343 | Tragic 33.3% |
| Inupiat | 0.0 /100 | #344 | Tragic 34.5% |
| Tohono O'odham | 0.0 /100 | #345 | Tragic 36.0% |
| Yup'ik | 0.0 /100 | #346 | Tragic 37.8% |
| Pima | 0.0 /100 | #347 | Tragic 38.6% |