Kiowa vs Armenian Cognitive Disability

COMPARE

Kiowa
Race
Ancestry
AfghanAfricanAlaska NativeAlaskan AthabascanAlbanianAleutAlsatianAmericanApacheArabArapahoArgentineanAssyrian/Chaldean/SyriacAustralianAustrianBahamianBangladeshiBarbadianBasqueBelgianBelizeanBermudanBhutaneseBlackfeetBolivianBrazilianBritishBritish West IndianBulgarianBurmeseCajunCambodianCanadianCape VerdeanCarpatho RusynCelticCentral AmericanCentral American IndianCherokeeCheyenneChickasawChileanChineseChippewaChoctawColombianColvilleComancheCosta RicanCreeCreekCroatianCrowCubanCypriotCzechCzechoslovakianDanishDelawareDominicanDutchDutch West IndianEastern EuropeanEcuadorianEgyptianEnglishEstonianEthiopianEuropeanFijianFilipinoFinnishFrenchFrench American IndianFrench CanadianGermanGerman RussianGhanaianGreekGuamanian/ChamorroGuatemalanGuyaneseHaitianHmongHonduranHopiHoumaHungarianIcelanderIndian (Asian)IndonesianInupiatIranianIraqiIrishIroquoisIsraeliItalianJamaicanJapaneseJordanianKenyanKiowaKoreanLaotianLatvianLebaneseLiberianLithuanianLumbeeLuxembourgerMacedonianMalaysianMalteseMarshalleseMenomineeMexicanMexican American IndianMongolianMoroccanNative HawaiianNavajoNepaleseNew ZealanderNicaraguanNigerianNorthern EuropeanNorwegianOkinawanOsageOttawaPaiutePakistaniPalestinianPanamanianParaguayanPennsylvania GermanPeruvianPimaPolishPortuguesePotawatomiPuebloPuerto RicanPuget Sound SalishRomanianRussianSalvadoranSamoanScandinavianScotch-IrishScottishSeminoleSenegaleseSerbianShoshoneSierra LeoneanSiouxSlavicSlovakSloveneSomaliSouth AfricanSouth AmericanSouth American IndianSoviet UnionSpaniardSpanishSpanish AmericanSpanish American IndianSri LankanSubsaharan AfricanSudaneseSwedishSwissSyrianTaiwaneseThaiTlingit-HaidaTohono O'OdhamTonganTrinidadian and TobagonianTsimshianTurkishU.S. Virgin IslanderUgandanUkrainianUruguayanUteVenezuelanVietnameseWelshWest IndianYakamaYaquiYugoslavianYumanYup'ikZimbabwean
Immigration
NonimmigrantsImmigrantsAfghanistanAfricaAlbaniaArgentinaArmeniaAsiaAustraliaAustriaBahamasBangladeshBarbadosBelarusBelgiumBelizeBoliviaBosnia and HerzegovinaBrazilBulgariaBurma/MyanmarCabo VerdeCambodiaCameroonCanadaCaribbeanCentral AmericaChileChinaColombiaCongoCosta RicaCroatiaCubaCzechoslovakiaDenmarkDominicaDominican RepublicEastern AfricaEastern AsiaEastern EuropeEcuadorEgyptEl SalvadorEnglandEritreaEthiopiaEuropeFijiFranceGermanyGhanaGreeceGrenadaGuatemalaGuyanaHaitiHondurasHong KongHungaryIndiaIndonesiaIranIraqIrelandIsraelItalyJamaicaJapanJordanKazakhstanKenyaKoreaKuwaitLaosLatin AmericaLatviaLebanonLiberiaLithuaniaMalaysiaMexicoMicronesiaMiddle AfricaMoldovaMoroccoNepalNetherlandsNicaraguaNigeriaNorth AmericaNorth MacedoniaNorthern AfricaNorthern EuropeNorwayOceaniaPakistanPanamaPeruPhilippinesPolandPortugalRomaniaRussiaSaudi ArabiaScotlandSenegalSerbiaSierra LeoneSingaporeSomaliaSouth AfricaSouth AmericaSouth Central AsiaSouth Eastern AsiaSouthern EuropeSpainSri LankaSt. Vincent and the GrenadinesSudanSwedenSwitzerlandSyriaTaiwanThailandTrinidad and TobagoTurkeyUgandaUkraineUruguayUzbekistanVenezuelaVietnamWest IndiesWestern AfricaWestern AsiaWestern EuropeYemenZaireZimbabweAzores
Armenian
Race
Ancestry
AfghanAfricanAlaska NativeAlaskan AthabascanAlbanianAleutAlsatianAmericanApacheArabArapahoArgentineanArmenianAssyrian/Chaldean/SyriacAustralianAustrianBahamianBangladeshiBarbadianBasqueBelgianBelizeanBermudanBhutaneseBlackfeetBolivianBrazilianBritishBritish West IndianBulgarianBurmeseCajunCambodianCanadianCape VerdeanCarpatho RusynCelticCentral AmericanCentral American IndianCherokeeCheyenneChickasawChileanChineseChippewaChoctawColombianColvilleComancheCosta RicanCreeCreekCroatianCrowCubanCypriotCzechCzechoslovakianDanishDelawareDominicanDutchDutch West IndianEastern EuropeanEcuadorianEgyptianEnglishEstonianEthiopianEuropeanFijianFilipinoFinnishFrenchFrench American IndianFrench CanadianGermanGerman RussianGhanaianGreekGuamanian/ChamorroGuatemalanGuyaneseHaitianHmongHonduranHopiHoumaHungarianIcelanderIndian (Asian)IndonesianInupiatIranianIraqiIrishIroquoisIsraeliItalianJamaicanJapaneseJordanianKenyanKoreanLaotianLatvianLebaneseLiberianLithuanianLumbeeLuxembourgerMacedonianMalaysianMalteseMarshalleseMenomineeMexicanMexican American IndianMongolianMoroccanNative HawaiianNavajoNepaleseNew ZealanderNicaraguanNigerianNorthern EuropeanNorwegianOkinawanOsageOttawaPaiutePakistaniPalestinianPanamanianParaguayanPennsylvania GermanPeruvianPimaPolishPortuguesePotawatomiPuebloPuerto RicanPuget Sound SalishRomanianRussianSalvadoranSamoanScandinavianScotch-IrishScottishSeminoleSenegaleseSerbianShoshoneSierra LeoneanSiouxSlavicSlovakSloveneSomaliSouth AfricanSouth AmericanSouth American IndianSoviet UnionSpaniardSpanishSpanish AmericanSpanish American IndianSri LankanSubsaharan AfricanSudaneseSwedishSwissSyrianTaiwaneseThaiTlingit-HaidaTohono O'OdhamTonganTrinidadian and TobagonianTsimshianTurkishU.S. Virgin IslanderUgandanUkrainianUruguayanUteVenezuelanVietnameseWelshWest IndianYakamaYaquiYugoslavianYumanYup'ikZimbabwean
Immigration
NonimmigrantsImmigrantsAfghanistanAfricaAlbaniaArgentinaArmeniaAsiaAustraliaAustriaBahamasBangladeshBarbadosBelarusBelgiumBelizeBoliviaBosnia and HerzegovinaBrazilBulgariaBurma/MyanmarCabo VerdeCambodiaCameroonCanadaCaribbeanCentral AmericaChileChinaColombiaCongoCosta RicaCroatiaCubaCzechoslovakiaDenmarkDominicaDominican RepublicEastern AfricaEastern AsiaEastern EuropeEcuadorEgyptEl SalvadorEnglandEritreaEthiopiaEuropeFijiFranceGermanyGhanaGreeceGrenadaGuatemalaGuyanaHaitiHondurasHong KongHungaryIndiaIndonesiaIranIraqIrelandIsraelItalyJamaicaJapanJordanKazakhstanKenyaKoreaKuwaitLaosLatin AmericaLatviaLebanonLiberiaLithuaniaMalaysiaMexicoMicronesiaMiddle AfricaMoldovaMoroccoNepalNetherlandsNicaraguaNigeriaNorth AmericaNorth MacedoniaNorthern AfricaNorthern EuropeNorwayOceaniaPakistanPanamaPeruPhilippinesPolandPortugalRomaniaRussiaSaudi ArabiaScotlandSenegalSerbiaSierra LeoneSingaporeSomaliaSouth AfricaSouth AmericaSouth Central AsiaSouth Eastern AsiaSouthern EuropeSpainSri LankaSt. Vincent and the GrenadinesSudanSwedenSwitzerlandSyriaTaiwanThailandTrinidad and TobagoTurkeyUgandaUkraineUruguayUzbekistanVenezuelaVietnamWest IndiesWestern AfricaWestern AsiaWestern EuropeYemenZaireZimbabweAzores
Cognitive Disability
Income
Poverty
Unemployment
Labor Participation
Family Structure
Vehicle Availability
Education Level
Disability

Cognitive Disability Comparison

Kiowa

Armenians

Tragic
Good
18.7%
COGNITIVE DISABILITY
0.0/ 100
METRIC RATING
328th/ 347
METRIC RANK
17.2%
COGNITIVE DISABILITY
70.1/ 100
METRIC RATING
164th/ 347
METRIC RANK

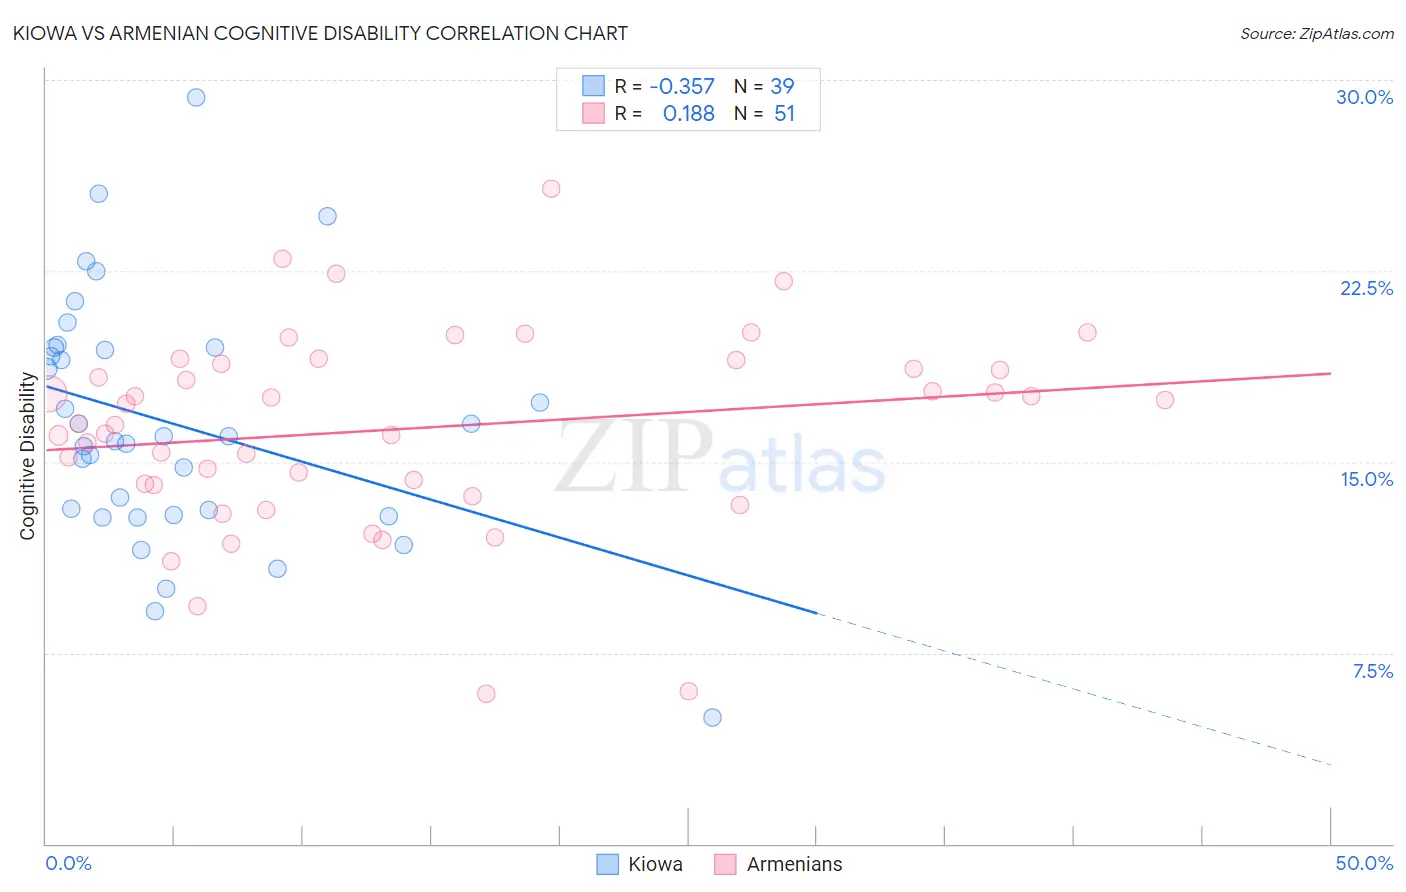
Kiowa vs Armenian Cognitive Disability Correlation Chart

The statistical analysis conducted on geographies consisting of 56,098,824 people shows a mild negative correlation between the proportion of Kiowa and percentage of population with cognitive disability in the United States with a correlation coefficient (R) of -0.357 and weighted average of 18.7%. Similarly, the statistical analysis conducted on geographies consisting of 310,934,651 people shows a poor positive correlation between the proportion of Armenians and percentage of population with cognitive disability in the United States with a correlation coefficient (R) of 0.188 and weighted average of 17.2%, a difference of 9.0%.
Kiowa vs Armenian Cognitive Disability

Cognitive Disability Correlation Summary

MeasurementKiowaArmenian
Minimum4.9%5.9%
Maximum29.3%25.7%
Range24.4%19.9%
Mean16.5%16.3%
Median16.0%16.5%
Interquartile 25% (IQ1)12.9%14.1%
Interquartile 75% (IQ3)19.5%18.8%
Interquartile Range (IQR)6.6%4.8%
Standard Deviation (Sample)4.8%3.9%
Standard Deviation (Population)4.8%3.9%

Similar Demographics by Cognitive Disability

Demographics Similar to Kiowa by Cognitive Disability

In terms of cognitive disability, the demographic groups most similar to Kiowa are U.S. Virgin Islander (18.7%, a difference of 0.060%), Immigrants from Senegal (18.7%, a difference of 0.10%), Indonesian (18.7%, a difference of 0.12%), Dominican (18.7%, a difference of 0.20%), and Navajo (18.8%, a difference of 0.22%).
DemographicsRating | RankCognitive Disability
Africans
0.0
/100
|
#321
Tragic
18.6%
Immigrants | Liberia
0.0
/100
|
#322
Tragic
18.7%
Pueblo
0.0
/100
|
#323
Tragic
18.7%
Dominicans
0.0
/100
|
#324
Tragic
18.7%
Indonesians
0.0
/100
|
#325
Tragic
18.7%
Immigrants | Senegal
0.0
/100
|
#326
Tragic
18.7%
U.S. Virgin Islanders
0.0
/100
|
#327
Tragic
18.7%
Kiowa
0.0
/100
|
#328
Tragic
18.7%
Navajo
0.0
/100
|
#329
Tragic
18.8%
Immigrants | Dominican Republic
0.0
/100
|
#330
Tragic
18.8%
Pima
0.0
/100
|
#331
Tragic
18.8%
Immigrants | Sudan
0.0
/100
|
#332
Tragic
18.8%
Immigrants | Yemen
0.0
/100
|
#333
Tragic
18.8%
Sudanese
0.0
/100
|
#334
Tragic
18.9%
Senegalese
0.0
/100
|
#335
Tragic
19.0%

Demographics Similar to Armenians by Cognitive Disability

In terms of cognitive disability, the demographic groups most similar to Armenians are Yugoslavian (17.2%, a difference of 0.050%), Immigrants from Switzerland (17.2%, a difference of 0.050%), American (17.2%, a difference of 0.070%), Australian (17.2%, a difference of 0.080%), and Immigrants from Latvia (17.2%, a difference of 0.11%).
DemographicsRating | RankCognitive Disability
Immigrants | Australia
76.0
/100
|
#157
Good
17.1%
Celtics
74.1
/100
|
#158
Good
17.1%
Immigrants | Latvia
73.2
/100
|
#159
Good
17.2%
Australians
72.4
/100
|
#160
Good
17.2%
Americans
72.2
/100
|
#161
Good
17.2%
Yugoslavians
71.6
/100
|
#162
Good
17.2%
Immigrants | Switzerland
71.5
/100
|
#163
Good
17.2%
Armenians
70.1
/100
|
#164
Good
17.2%
Immigrants | Albania
64.9
/100
|
#165
Good
17.2%
Immigrants | Ecuador
64.4
/100
|
#166
Good
17.2%
Immigrants | Syria
63.5
/100
|
#167
Good
17.2%
Immigrants | Immigrants
62.5
/100
|
#168
Good
17.2%
Immigrants | Portugal
61.8
/100
|
#169
Good
17.2%
Ecuadorians
59.6
/100
|
#170
Average
17.2%
Tlingit-Haida
59.4
/100
|
#171
Average
17.2%