Kiowa vs Italian Unemployment
COMPARE
Kiowa
Italian
Unemployment
Unemployment Comparison
Kiowa
Italians
5.7%
UNEMPLOYMENT
0.6/ 100
METRIC RATING
251st/ 347
METRIC RANK
4.9%
UNEMPLOYMENT
98.9/ 100
METRIC RATING
64th/ 347
METRIC RANK
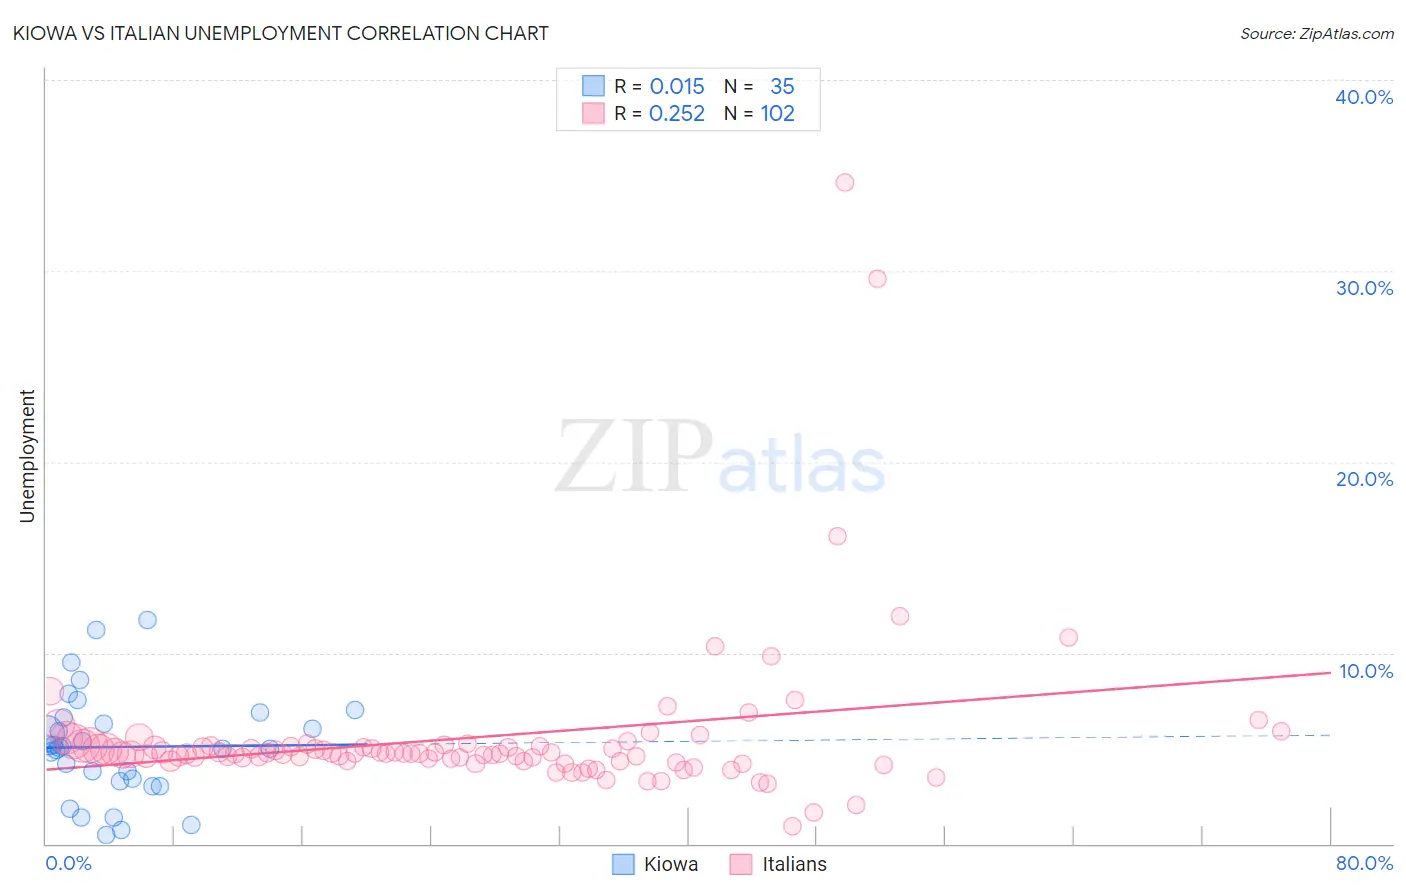
Kiowa vs Italian Unemployment Correlation Chart
The statistical analysis conducted on geographies consisting of 56,085,771 people shows no correlation between the proportion of Kiowa and unemployment in the United States with a correlation coefficient (R) of 0.015 and weighted average of 5.7%. Similarly, the statistical analysis conducted on geographies consisting of 570,806,314 people shows a weak positive correlation between the proportion of Italians and unemployment in the United States with a correlation coefficient (R) of 0.252 and weighted average of 4.9%, a difference of 15.9%.
Unemployment Correlation Summary
| Measurement | Kiowa | Italian |
| Minimum | 0.44% | 0.90% |
| Maximum | 11.7% | 34.6% |
| Range | 11.3% | 33.7% |
| Mean | 5.1% | 5.6% |
| Median | 5.1% | 4.7% |
| Interquartile 25% (IQ1) | 3.3% | 4.3% |
| Interquartile 75% (IQ3) | 6.6% | 5.1% |
| Interquartile Range (IQR) | 3.3% | 0.77% |
| Standard Deviation (Sample) | 2.7% | 4.2% |
| Standard Deviation (Population) | 2.7% | 4.2% |
Similar Demographics by Unemployment
Demographics Similar to Kiowa by Unemployment
In terms of unemployment, the demographic groups most similar to Kiowa are Japanese (5.6%, a difference of 0.47%), Cajun (5.6%, a difference of 0.48%), Liberian (5.6%, a difference of 0.74%), Honduran (5.7%, a difference of 0.74%), and Central American (5.7%, a difference of 0.75%).
| Demographics | Rating | Rank | Unemployment |
| Dutch West Indians | 1.2 /100 | #244 | Tragic 5.6% |
| French American Indians | 1.2 /100 | #245 | Tragic 5.6% |
| Bermudans | 1.1 /100 | #246 | Tragic 5.6% |
| Immigrants | Cameroon | 1.0 /100 | #247 | Tragic 5.6% |
| Liberians | 0.9 /100 | #248 | Tragic 5.6% |
| Cajuns | 0.8 /100 | #249 | Tragic 5.6% |
| Japanese | 0.8 /100 | #250 | Tragic 5.6% |
| Kiowa | 0.6 /100 | #251 | Tragic 5.7% |
| Hondurans | 0.3 /100 | #252 | Tragic 5.7% |
| Central Americans | 0.3 /100 | #253 | Tragic 5.7% |
| Immigrants | Honduras | 0.3 /100 | #254 | Tragic 5.7% |
| Immigrants | Portugal | 0.2 /100 | #255 | Tragic 5.7% |
| Guatemalans | 0.2 /100 | #256 | Tragic 5.8% |
| Yaqui | 0.2 /100 | #257 | Tragic 5.8% |
| Immigrants | Bahamas | 0.1 /100 | #258 | Tragic 5.8% |
Demographics Similar to Italians by Unemployment
In terms of unemployment, the demographic groups most similar to Italians are Immigrants from Bulgaria (4.9%, a difference of 0.080%), Icelander (4.9%, a difference of 0.10%), Immigrants from Netherlands (4.9%, a difference of 0.11%), Cambodian (4.9%, a difference of 0.11%), and Immigrants from Canada (4.9%, a difference of 0.14%).
| Demographics | Rating | Rank | Unemployment |
| Immigrants | Singapore | 99.1 /100 | #57 | Exceptional 4.9% |
| Greeks | 99.0 /100 | #58 | Exceptional 4.9% |
| Bhutanese | 99.0 /100 | #59 | Exceptional 4.9% |
| Immigrants | Netherlands | 99.0 /100 | #60 | Exceptional 4.9% |
| Cambodians | 99.0 /100 | #61 | Exceptional 4.9% |
| Icelanders | 98.9 /100 | #62 | Exceptional 4.9% |
| Immigrants | Bulgaria | 98.9 /100 | #63 | Exceptional 4.9% |
| Italians | 98.9 /100 | #64 | Exceptional 4.9% |
| Immigrants | Canada | 98.8 /100 | #65 | Exceptional 4.9% |
| Slovaks | 98.7 /100 | #66 | Exceptional 4.9% |
| New Zealanders | 98.6 /100 | #67 | Exceptional 4.9% |
| Slavs | 98.6 /100 | #68 | Exceptional 4.9% |
| Immigrants | North America | 98.5 /100 | #69 | Exceptional 4.9% |
| Serbians | 98.4 /100 | #70 | Exceptional 4.9% |
| Immigrants | Japan | 98.3 /100 | #71 | Exceptional 4.9% |