Bahamian vs Lithuanian Cognitive Disability
COMPARE
Bahamian
Lithuanian
Cognitive Disability
Cognitive Disability Comparison
Bahamians
Lithuanians
17.9%
COGNITIVE DISABILITY
0.6/ 100
METRIC RATING
256th/ 347
METRIC RANK
16.3%
COGNITIVE DISABILITY
100.0/ 100
METRIC RATING
13th/ 347
METRIC RANK
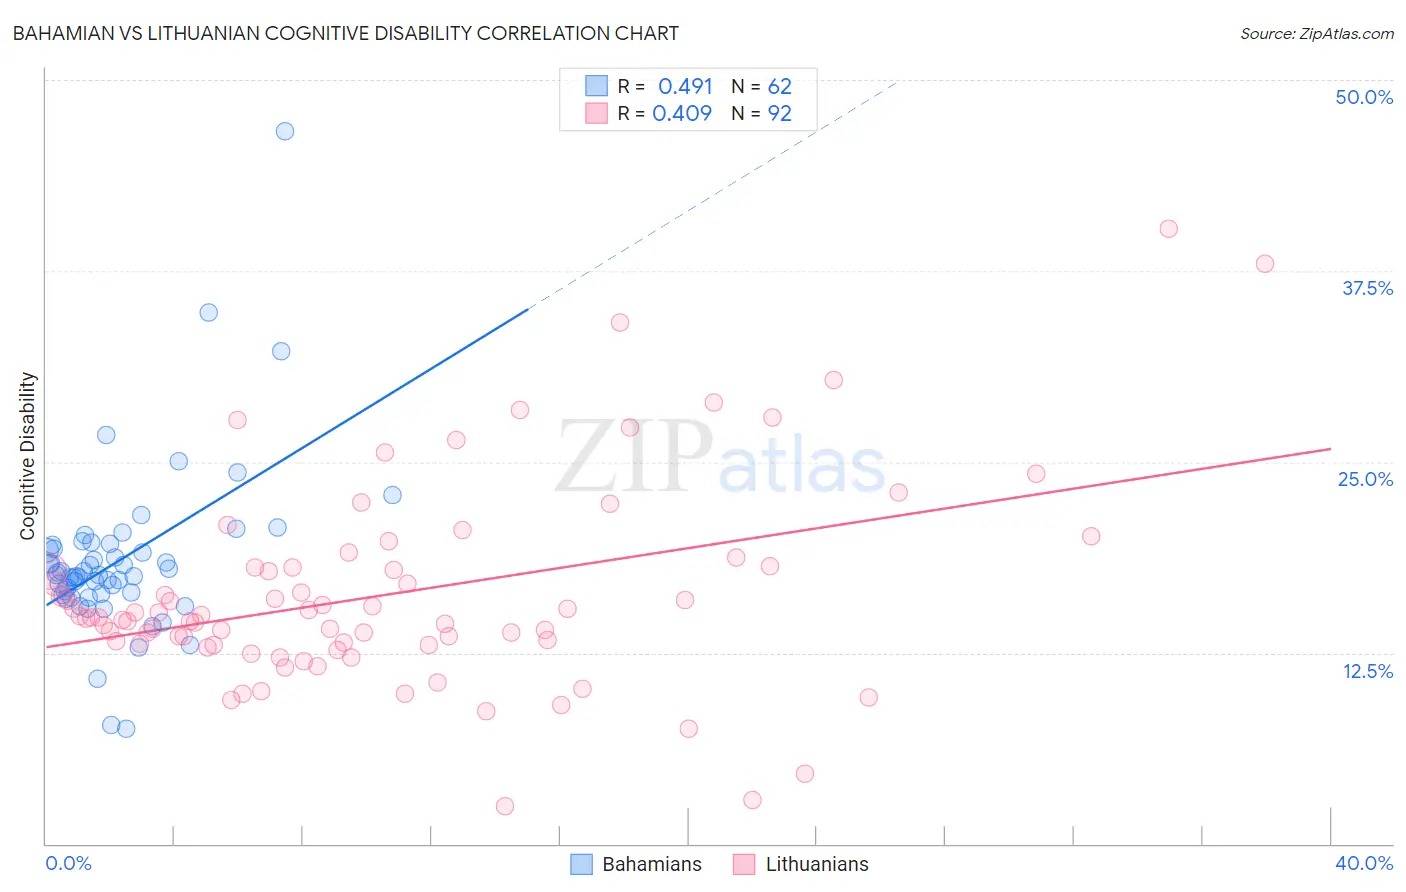
Bahamian vs Lithuanian Cognitive Disability Correlation Chart
The statistical analysis conducted on geographies consisting of 112,674,908 people shows a moderate positive correlation between the proportion of Bahamians and percentage of population with cognitive disability in the United States with a correlation coefficient (R) of 0.491 and weighted average of 17.9%. Similarly, the statistical analysis conducted on geographies consisting of 421,943,876 people shows a moderate positive correlation between the proportion of Lithuanians and percentage of population with cognitive disability in the United States with a correlation coefficient (R) of 0.409 and weighted average of 16.3%, a difference of 10.2%.
Cognitive Disability Correlation Summary
| Measurement | Bahamian | Lithuanian |
| Minimum | 7.5% | 2.5% |
| Maximum | 46.6% | 40.3% |
| Range | 39.1% | 37.8% |
| Mean | 18.6% | 16.3% |
| Median | 17.6% | 14.8% |
| Interquartile 25% (IQ1) | 16.4% | 13.1% |
| Interquartile 75% (IQ3) | 19.6% | 18.1% |
| Interquartile Range (IQR) | 3.2% | 5.0% |
| Standard Deviation (Sample) | 5.6% | 6.6% |
| Standard Deviation (Population) | 5.6% | 6.6% |
Similar Demographics by Cognitive Disability
Demographics Similar to Bahamians by Cognitive Disability
In terms of cognitive disability, the demographic groups most similar to Bahamians are Immigrants from the Azores (17.9%, a difference of 0.0%), Hopi (17.9%, a difference of 0.010%), Hispanic or Latino (17.9%, a difference of 0.010%), Immigrants from Grenada (17.9%, a difference of 0.020%), and Malaysian (17.9%, a difference of 0.030%).
| Demographics | Rating | Rank | Cognitive Disability |
| Cree | 0.7 /100 | #249 | Tragic 17.9% |
| Immigrants | Ethiopia | 0.7 /100 | #250 | Tragic 17.9% |
| Malaysians | 0.6 /100 | #251 | Tragic 17.9% |
| Immigrants | Grenada | 0.6 /100 | #252 | Tragic 17.9% |
| Hopi | 0.6 /100 | #253 | Tragic 17.9% |
| Hispanics or Latinos | 0.6 /100 | #254 | Tragic 17.9% |
| Immigrants | Azores | 0.6 /100 | #255 | Tragic 17.9% |
| Bahamians | 0.6 /100 | #256 | Tragic 17.9% |
| Mexican American Indians | 0.6 /100 | #257 | Tragic 17.9% |
| Immigrants | Armenia | 0.6 /100 | #258 | Tragic 17.9% |
| Ethiopians | 0.5 /100 | #259 | Tragic 17.9% |
| Immigrants | Belize | 0.5 /100 | #260 | Tragic 17.9% |
| Guamanians/Chamorros | 0.5 /100 | #261 | Tragic 17.9% |
| Sierra Leoneans | 0.4 /100 | #262 | Tragic 17.9% |
| Immigrants | Barbados | 0.4 /100 | #263 | Tragic 17.9% |
Demographics Similar to Lithuanians by Cognitive Disability
In terms of cognitive disability, the demographic groups most similar to Lithuanians are Immigrants from Austria (16.3%, a difference of 0.060%), Maltese (16.2%, a difference of 0.090%), Immigrants from Greece (16.3%, a difference of 0.090%), Immigrants from Czechoslovakia (16.2%, a difference of 0.25%), and Immigrants from Scotland (16.2%, a difference of 0.34%).
| Demographics | Rating | Rank | Cognitive Disability |
| Thais | 100.0 /100 | #6 | Exceptional 16.1% |
| Immigrants | Ireland | 100.0 /100 | #7 | Exceptional 16.1% |
| Immigrants | Poland | 100.0 /100 | #8 | Exceptional 16.1% |
| Assyrians/Chaldeans/Syriacs | 100.0 /100 | #9 | Exceptional 16.2% |
| Immigrants | Scotland | 100.0 /100 | #10 | Exceptional 16.2% |
| Immigrants | Czechoslovakia | 100.0 /100 | #11 | Exceptional 16.2% |
| Maltese | 100.0 /100 | #12 | Exceptional 16.2% |
| Lithuanians | 100.0 /100 | #13 | Exceptional 16.3% |
| Immigrants | Austria | 100.0 /100 | #14 | Exceptional 16.3% |
| Immigrants | Greece | 100.0 /100 | #15 | Exceptional 16.3% |
| Eastern Europeans | 100.0 /100 | #16 | Exceptional 16.3% |
| Immigrants | North Macedonia | 100.0 /100 | #17 | Exceptional 16.3% |
| Immigrants | Northern Europe | 100.0 /100 | #18 | Exceptional 16.3% |
| Immigrants | Bolivia | 100.0 /100 | #19 | Exceptional 16.3% |
| Bulgarians | 100.0 /100 | #20 | Exceptional 16.3% |