Cape Verdean vs Immigrants from South Africa Hearing Disability
COMPARE
Cape Verdean
Immigrants from South Africa
Hearing Disability
Hearing Disability Comparison
Cape Verdeans
Immigrants from South Africa
3.1%
HEARING DISABILITY
12.2/ 100
METRIC RATING
210th/ 347
METRIC RANK
3.1%
HEARING DISABILITY
31.1/ 100
METRIC RATING
190th/ 347
METRIC RANK
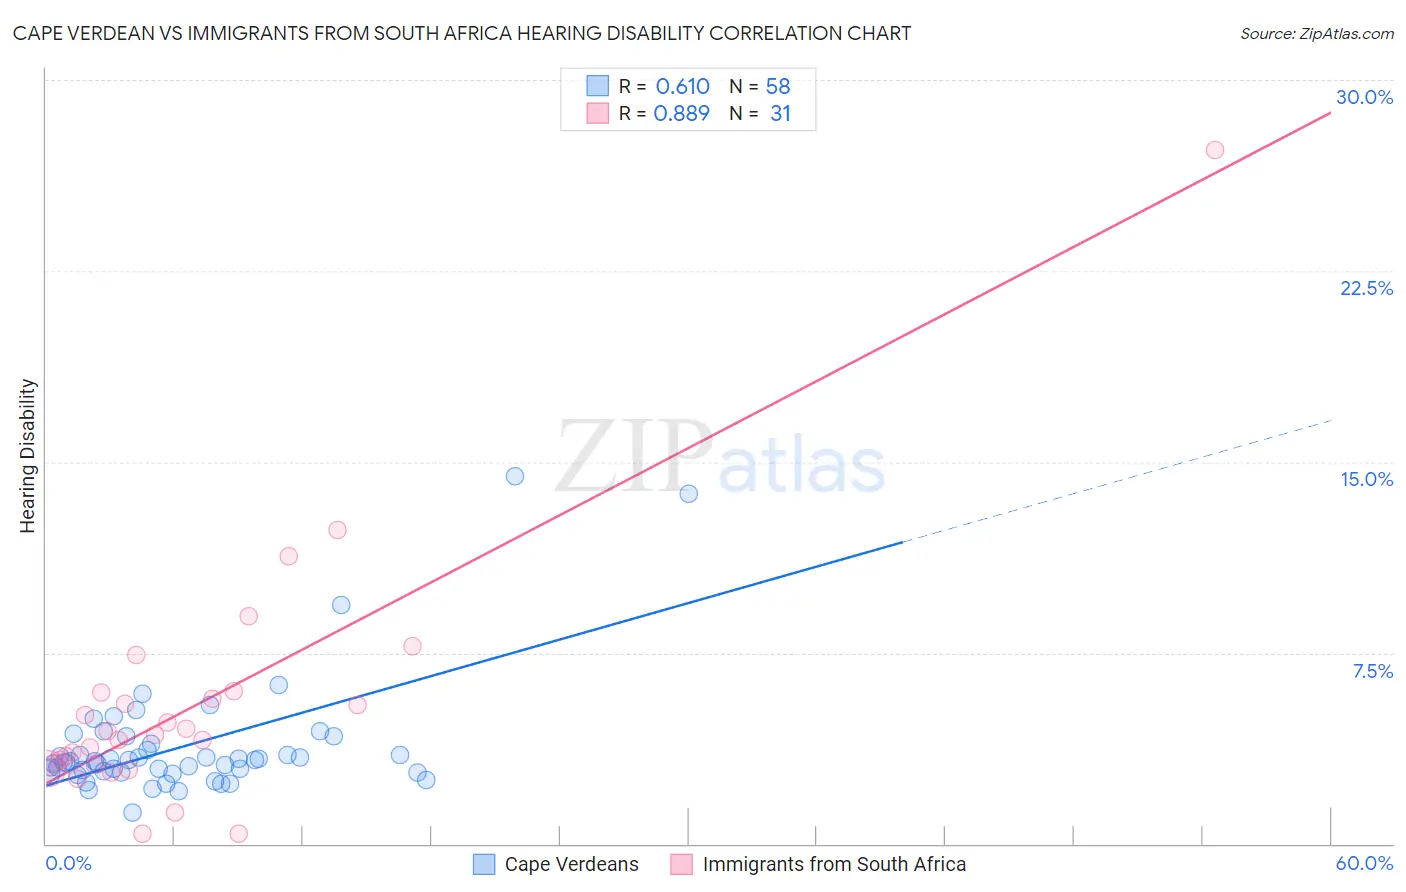
Cape Verdean vs Immigrants from South Africa Hearing Disability Correlation Chart
The statistical analysis conducted on geographies consisting of 107,552,896 people shows a significant positive correlation between the proportion of Cape Verdeans and percentage of population with hearing disability in the United States with a correlation coefficient (R) of 0.610 and weighted average of 3.1%. Similarly, the statistical analysis conducted on geographies consisting of 233,290,036 people shows a very strong positive correlation between the proportion of Immigrants from South Africa and percentage of population with hearing disability in the United States with a correlation coefficient (R) of 0.889 and weighted average of 3.1%, a difference of 2.7%.
Hearing Disability Correlation Summary
| Measurement | Cape Verdean | Immigrants from South Africa |
| Minimum | 1.2% | 0.40% |
| Maximum | 14.5% | 27.3% |
| Range | 13.2% | 26.9% |
| Mean | 3.8% | 5.4% |
| Median | 3.2% | 4.3% |
| Interquartile 25% (IQ1) | 2.8% | 3.1% |
| Interquartile 75% (IQ3) | 3.9% | 6.0% |
| Interquartile Range (IQR) | 1.1% | 2.9% |
| Standard Deviation (Sample) | 2.3% | 4.9% |
| Standard Deviation (Population) | 2.3% | 4.8% |
Demographics Similar to Cape Verdeans and Immigrants from South Africa by Hearing Disability
In terms of hearing disability, the demographic groups most similar to Cape Verdeans are Immigrants from Hungary (3.1%, a difference of 0.050%), Immigrants from Latvia (3.1%, a difference of 0.090%), Hispanic or Latino (3.1%, a difference of 0.55%), Eastern European (3.1%, a difference of 0.61%), and Immigrants from Czechoslovakia (3.1%, a difference of 0.68%). Similarly, the demographic groups most similar to Immigrants from South Africa are Immigrants from Switzerland (3.1%, a difference of 0.25%), Korean (3.1%, a difference of 0.38%), Macedonian (3.1%, a difference of 0.46%), South African (3.1%, a difference of 0.76%), and Spanish American Indian (3.1%, a difference of 0.81%).
| Demographics | Rating | Rank | Hearing Disability |
| Immigrants | South Africa | 31.1 /100 | #190 | Fair 3.1% |
| Immigrants | Switzerland | 28.8 /100 | #191 | Fair 3.1% |
| Koreans | 27.6 /100 | #192 | Fair 3.1% |
| Macedonians | 27.0 /100 | #193 | Fair 3.1% |
| South Africans | 24.5 /100 | #194 | Fair 3.1% |
| Spanish American Indians | 24.1 /100 | #195 | Fair 3.1% |
| Immigrants | Europe | 22.9 /100 | #196 | Fair 3.1% |
| Immigrants | Bosnia and Herzegovina | 20.6 /100 | #197 | Fair 3.1% |
| Immigrants | Croatia | 20.5 /100 | #198 | Fair 3.1% |
| Syrians | 19.2 /100 | #199 | Poor 3.1% |
| Immigrants | North Macedonia | 19.1 /100 | #200 | Poor 3.1% |
| Iraqis | 19.0 /100 | #201 | Poor 3.1% |
| Immigrants | Thailand | 16.4 /100 | #202 | Poor 3.1% |
| Immigrants | Denmark | 16.2 /100 | #203 | Poor 3.1% |
| Immigrants | Czechoslovakia | 15.9 /100 | #204 | Poor 3.1% |
| Alsatians | 15.9 /100 | #205 | Poor 3.1% |
| Eastern Europeans | 15.5 /100 | #206 | Poor 3.1% |
| Hispanics or Latinos | 15.1 /100 | #207 | Poor 3.1% |
| Immigrants | Latvia | 12.7 /100 | #208 | Poor 3.1% |
| Immigrants | Hungary | 12.5 /100 | #209 | Poor 3.1% |
| Cape Verdeans | 12.2 /100 | #210 | Poor 3.1% |