Immigrants from Cabo Verde vs Immigrants from South Africa Hearing Disability
COMPARE
Immigrants from Cabo Verde
Immigrants from South Africa
Hearing Disability
Hearing Disability Comparison
Immigrants from Cabo Verde
Immigrants from South Africa
3.0%
HEARING DISABILITY
56.9/ 100
METRIC RATING
170th/ 347
METRIC RANK
3.1%
HEARING DISABILITY
31.1/ 100
METRIC RATING
190th/ 347
METRIC RANK
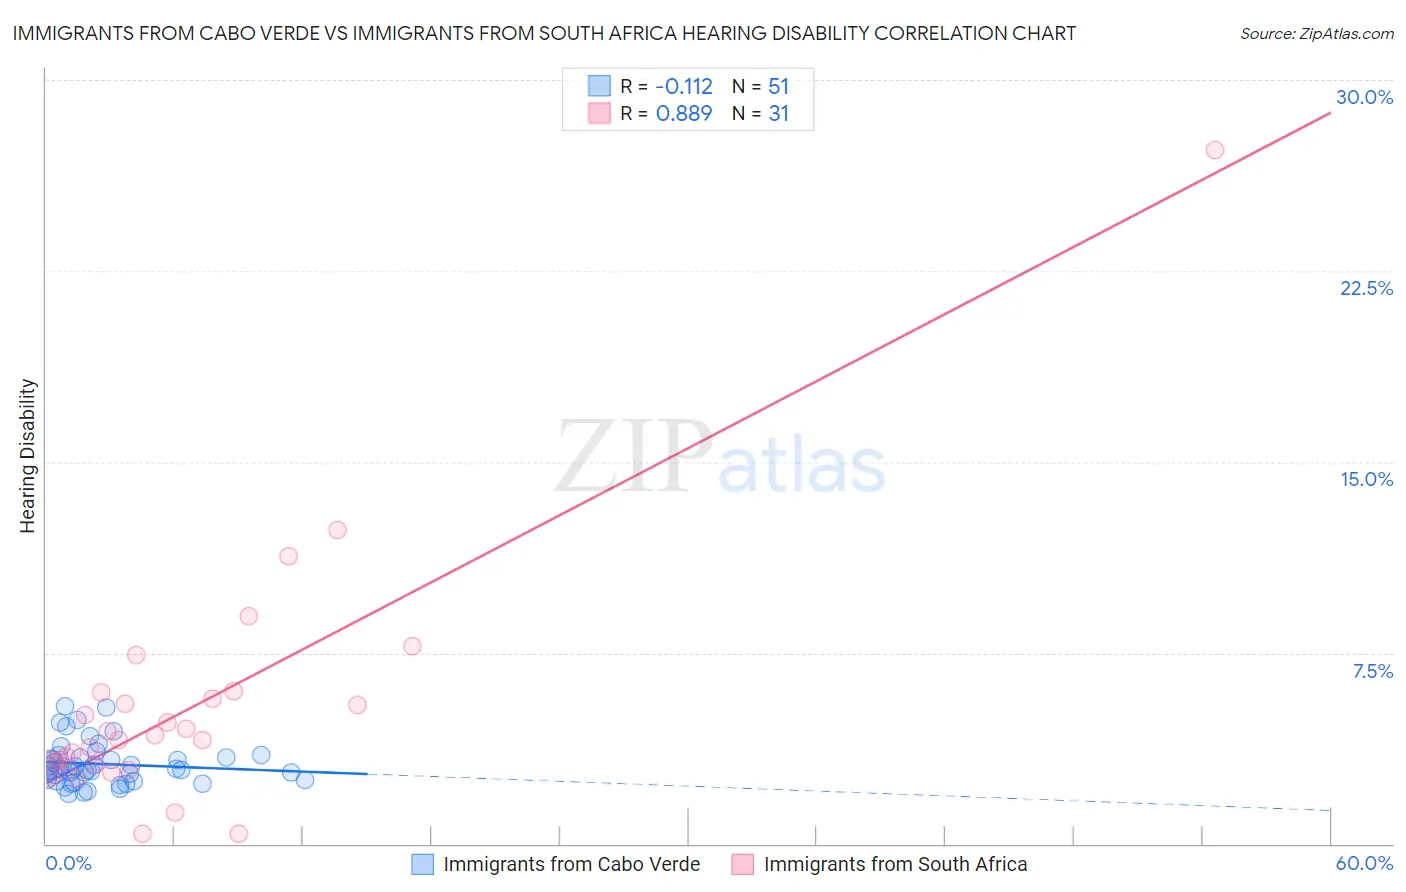
Immigrants from Cabo Verde vs Immigrants from South Africa Hearing Disability Correlation Chart
The statistical analysis conducted on geographies consisting of 38,139,523 people shows a poor negative correlation between the proportion of Immigrants from Cabo Verde and percentage of population with hearing disability in the United States with a correlation coefficient (R) of -0.112 and weighted average of 3.0%. Similarly, the statistical analysis conducted on geographies consisting of 233,290,036 people shows a very strong positive correlation between the proportion of Immigrants from South Africa and percentage of population with hearing disability in the United States with a correlation coefficient (R) of 0.889 and weighted average of 3.1%, a difference of 2.5%.
Hearing Disability Correlation Summary
| Measurement | Immigrants from Cabo Verde | Immigrants from South Africa |
| Minimum | 2.0% | 0.40% |
| Maximum | 5.4% | 27.3% |
| Range | 3.4% | 26.9% |
| Mean | 3.1% | 5.4% |
| Median | 2.9% | 4.3% |
| Interquartile 25% (IQ1) | 2.5% | 3.1% |
| Interquartile 75% (IQ3) | 3.4% | 6.0% |
| Interquartile Range (IQR) | 0.92% | 2.9% |
| Standard Deviation (Sample) | 0.82% | 4.9% |
| Standard Deviation (Population) | 0.82% | 4.8% |
Demographics Similar to Immigrants from Cabo Verde and Immigrants from South Africa by Hearing Disability
In terms of hearing disability, the demographic groups most similar to Immigrants from Cabo Verde are Immigrants from Ukraine (3.0%, a difference of 0.030%), Armenian (3.0%, a difference of 0.090%), Immigrants from Serbia (3.0%, a difference of 0.56%), Indonesian (3.0%, a difference of 0.66%), and Immigrants from Romania (3.0%, a difference of 0.81%). Similarly, the demographic groups most similar to Immigrants from South Africa are African (3.0%, a difference of 0.19%), Black/African American (3.0%, a difference of 0.38%), Mexican American Indian (3.0%, a difference of 0.38%), Immigrants from Mexico (3.0%, a difference of 0.40%), and Immigrants from Southern Europe (3.0%, a difference of 0.44%).
| Demographics | Rating | Rank | Hearing Disability |
| Immigrants | Cabo Verde | 56.9 /100 | #170 | Average 3.0% |
| Immigrants | Ukraine | 56.6 /100 | #171 | Average 3.0% |
| Armenians | 56.0 /100 | #172 | Average 3.0% |
| Immigrants | Serbia | 51.1 /100 | #173 | Average 3.0% |
| Indonesians | 50.0 /100 | #174 | Average 3.0% |
| Immigrants | Romania | 48.4 /100 | #175 | Average 3.0% |
| Panamanians | 47.0 /100 | #176 | Average 3.0% |
| Immigrants | Philippines | 46.4 /100 | #177 | Average 3.0% |
| Japanese | 46.0 /100 | #178 | Average 3.0% |
| Immigrants | Moldova | 43.1 /100 | #179 | Average 3.0% |
| Immigrants | Sweden | 42.4 /100 | #180 | Average 3.0% |
| Immigrants | Belgium | 41.5 /100 | #181 | Average 3.0% |
| Immigrants | Italy | 41.1 /100 | #182 | Average 3.0% |
| Bulgarians | 39.7 /100 | #183 | Fair 3.0% |
| Immigrants | Ireland | 37.4 /100 | #184 | Fair 3.0% |
| Immigrants | Southern Europe | 35.3 /100 | #185 | Fair 3.0% |
| Immigrants | Mexico | 34.9 /100 | #186 | Fair 3.0% |
| Blacks/African Americans | 34.7 /100 | #187 | Fair 3.0% |
| Mexican American Indians | 34.7 /100 | #188 | Fair 3.0% |
| Africans | 32.9 /100 | #189 | Fair 3.0% |
| Immigrants | South Africa | 31.1 /100 | #190 | Fair 3.1% |