Slovene vs Immigrants from Belgium Cognitive Disability

COMPARE

Slovene
Race
Ancestry
AfghanAfricanAlaska NativeAlaskan AthabascanAlbanianAleutAlsatianAmericanApacheArabArapahoArgentineanArmenianAssyrian/Chaldean/SyriacAustralianAustrianBahamianBangladeshiBarbadianBasqueBelgianBelizeanBermudanBhutaneseBlackfeetBolivianBrazilianBritishBritish West IndianBulgarianBurmeseCajunCambodianCanadianCape VerdeanCarpatho RusynCelticCentral AmericanCentral American IndianCherokeeCheyenneChickasawChileanChineseChippewaChoctawColombianColvilleComancheCosta RicanCreeCreekCroatianCrowCubanCypriotCzechCzechoslovakianDanishDelawareDominicanDutchDutch West IndianEastern EuropeanEcuadorianEgyptianEnglishEstonianEthiopianEuropeanFijianFilipinoFinnishFrenchFrench American IndianFrench CanadianGermanGerman RussianGhanaianGreekGuamanian/ChamorroGuatemalanGuyaneseHaitianHmongHonduranHopiHoumaHungarianIcelanderIndian (Asian)IndonesianInupiatIranianIraqiIrishIroquoisIsraeliItalianJamaicanJapaneseJordanianKenyanKiowaKoreanLaotianLatvianLebaneseLiberianLithuanianLumbeeLuxembourgerMacedonianMalaysianMalteseMarshalleseMenomineeMexicanMexican American IndianMongolianMoroccanNative HawaiianNavajoNepaleseNew ZealanderNicaraguanNigerianNorthern EuropeanNorwegianOkinawanOsageOttawaPaiutePakistaniPalestinianPanamanianParaguayanPennsylvania GermanPeruvianPimaPolishPortuguesePotawatomiPuebloPuerto RicanPuget Sound SalishRomanianRussianSalvadoranSamoanScandinavianScotch-IrishScottishSeminoleSenegaleseSerbianShoshoneSierra LeoneanSiouxSlavicSlovakSloveneSomaliSouth AfricanSouth AmericanSouth American IndianSoviet UnionSpaniardSpanishSpanish AmericanSpanish American IndianSri LankanSubsaharan AfricanSudaneseSwedishSwissSyrianTaiwaneseThaiTlingit-HaidaTohono O'OdhamTonganTrinidadian and TobagonianTsimshianTurkishU.S. Virgin IslanderUgandanUkrainianUruguayanUteVenezuelanVietnameseWelshWest IndianYakamaYaquiYugoslavianYumanYup'ikZimbabwean
Immigration
NonimmigrantsImmigrantsAfghanistanAfricaAlbaniaArgentinaArmeniaAsiaAustraliaAustriaBahamasBangladeshBarbadosBelarusBelizeBoliviaBosnia and HerzegovinaBrazilBulgariaBurma/MyanmarCabo VerdeCambodiaCameroonCanadaCaribbeanCentral AmericaChileChinaColombiaCongoCosta RicaCroatiaCubaCzechoslovakiaDenmarkDominicaDominican RepublicEastern AfricaEastern AsiaEastern EuropeEcuadorEgyptEl SalvadorEnglandEritreaEthiopiaEuropeFijiFranceGermanyGhanaGreeceGrenadaGuatemalaGuyanaHaitiHondurasHong KongHungaryIndiaIndonesiaIranIraqIrelandIsraelItalyJamaicaJapanJordanKazakhstanKenyaKoreaKuwaitLaosLatin AmericaLatviaLebanonLiberiaLithuaniaMalaysiaMexicoMicronesiaMiddle AfricaMoldovaMoroccoNepalNetherlandsNicaraguaNigeriaNorth AmericaNorth MacedoniaNorthern AfricaNorthern EuropeNorwayOceaniaPakistanPanamaPeruPhilippinesPolandPortugalRomaniaRussiaSaudi ArabiaScotlandSenegalSerbiaSierra LeoneSingaporeSomaliaSouth AfricaSouth AmericaSouth Central AsiaSouth Eastern AsiaSouthern EuropeSpainSri LankaSt. Vincent and the GrenadinesSudanSwedenSwitzerlandSyriaTaiwanThailandTrinidad and TobagoTurkeyUgandaUkraineUruguayUzbekistanVenezuelaVietnamWest IndiesWestern AfricaWestern AsiaWestern EuropeYemenZaireZimbabweAzores
Immigrants from Belgium
Race
Ancestry
AfghanAfricanAlaska NativeAlaskan AthabascanAlbanianAleutAlsatianAmericanApacheArabArapahoArgentineanArmenianAssyrian/Chaldean/SyriacAustralianAustrianBahamianBangladeshiBarbadianBasqueBelgianBelizeanBermudanBhutaneseBlackfeetBolivianBrazilianBritishBritish West IndianBulgarianBurmeseCajunCambodianCanadianCape VerdeanCarpatho RusynCelticCentral AmericanCentral American IndianCherokeeCheyenneChickasawChileanChineseChippewaChoctawColombianColvilleComancheCosta RicanCreeCreekCroatianCrowCubanCypriotCzechCzechoslovakianDanishDelawareDominicanDutchDutch West IndianEastern EuropeanEcuadorianEgyptianEnglishEstonianEthiopianEuropeanFijianFilipinoFinnishFrenchFrench American IndianFrench CanadianGermanGerman RussianGhanaianGreekGuamanian/ChamorroGuatemalanGuyaneseHaitianHmongHonduranHopiHoumaHungarianIcelanderIndian (Asian)IndonesianInupiatIranianIraqiIrishIroquoisIsraeliItalianJamaicanJapaneseJordanianKenyanKiowaKoreanLaotianLatvianLebaneseLiberianLithuanianLumbeeLuxembourgerMacedonianMalaysianMalteseMarshalleseMenomineeMexicanMexican American IndianMongolianMoroccanNative HawaiianNavajoNepaleseNew ZealanderNicaraguanNigerianNorthern EuropeanNorwegianOkinawanOsageOttawaPaiutePakistaniPalestinianPanamanianParaguayanPennsylvania GermanPeruvianPimaPolishPortuguesePotawatomiPuebloPuerto RicanPuget Sound SalishRomanianRussianSalvadoranSamoanScandinavianScotch-IrishScottishSeminoleSenegaleseSerbianShoshoneSierra LeoneanSiouxSlavicSlovakSomaliSouth AfricanSouth AmericanSouth American IndianSoviet UnionSpaniardSpanishSpanish AmericanSpanish American IndianSri LankanSubsaharan AfricanSudaneseSwedishSwissSyrianTaiwaneseThaiTlingit-HaidaTohono O'OdhamTonganTrinidadian and TobagonianTsimshianTurkishU.S. Virgin IslanderUgandanUkrainianUruguayanUteVenezuelanVietnameseWelshWest IndianYakamaYaquiYugoslavianYumanYup'ikZimbabwean
Immigration
NonimmigrantsImmigrantsAfghanistanAfricaAlbaniaArgentinaArmeniaAsiaAustraliaAustriaBahamasBangladeshBarbadosBelarusBelgiumBelizeBoliviaBosnia and HerzegovinaBrazilBulgariaBurma/MyanmarCabo VerdeCambodiaCameroonCanadaCaribbeanCentral AmericaChileChinaColombiaCongoCosta RicaCroatiaCubaCzechoslovakiaDenmarkDominicaDominican RepublicEastern AfricaEastern AsiaEastern EuropeEcuadorEgyptEl SalvadorEnglandEritreaEthiopiaEuropeFijiFranceGermanyGhanaGreeceGrenadaGuatemalaGuyanaHaitiHondurasHong KongHungaryIndiaIndonesiaIranIraqIrelandIsraelItalyJamaicaJapanJordanKazakhstanKenyaKoreaKuwaitLaosLatin AmericaLatviaLebanonLiberiaLithuaniaMalaysiaMexicoMicronesiaMiddle AfricaMoldovaMoroccoNepalNetherlandsNicaraguaNigeriaNorth AmericaNorth MacedoniaNorthern AfricaNorthern EuropeNorwayOceaniaPakistanPanamaPeruPhilippinesPolandPortugalRomaniaRussiaSaudi ArabiaScotlandSenegalSerbiaSierra LeoneSingaporeSomaliaSouth AfricaSouth AmericaSouth Central AsiaSouth Eastern AsiaSouthern EuropeSpainSri LankaSt. Vincent and the GrenadinesSudanSwedenSwitzerlandSyriaTaiwanThailandTrinidad and TobagoTurkeyUgandaUkraineUruguayUzbekistanVenezuelaVietnamWest IndiesWestern AfricaWestern AsiaWestern EuropeYemenZaireZimbabweAzores
Cognitive Disability
Income
Poverty
Unemployment
Labor Participation
Family Structure
Vehicle Availability
Education Level
Disability

Cognitive Disability Comparison

Slovenes

Immigrants from Belgium

Exceptional
Exceptional
16.5%
COGNITIVE DISABILITY
99.9/ 100
METRIC RATING
37th/ 347
METRIC RANK
16.7%
COGNITIVE DISABILITY
99.3/ 100
METRIC RATING
71st/ 347
METRIC RANK

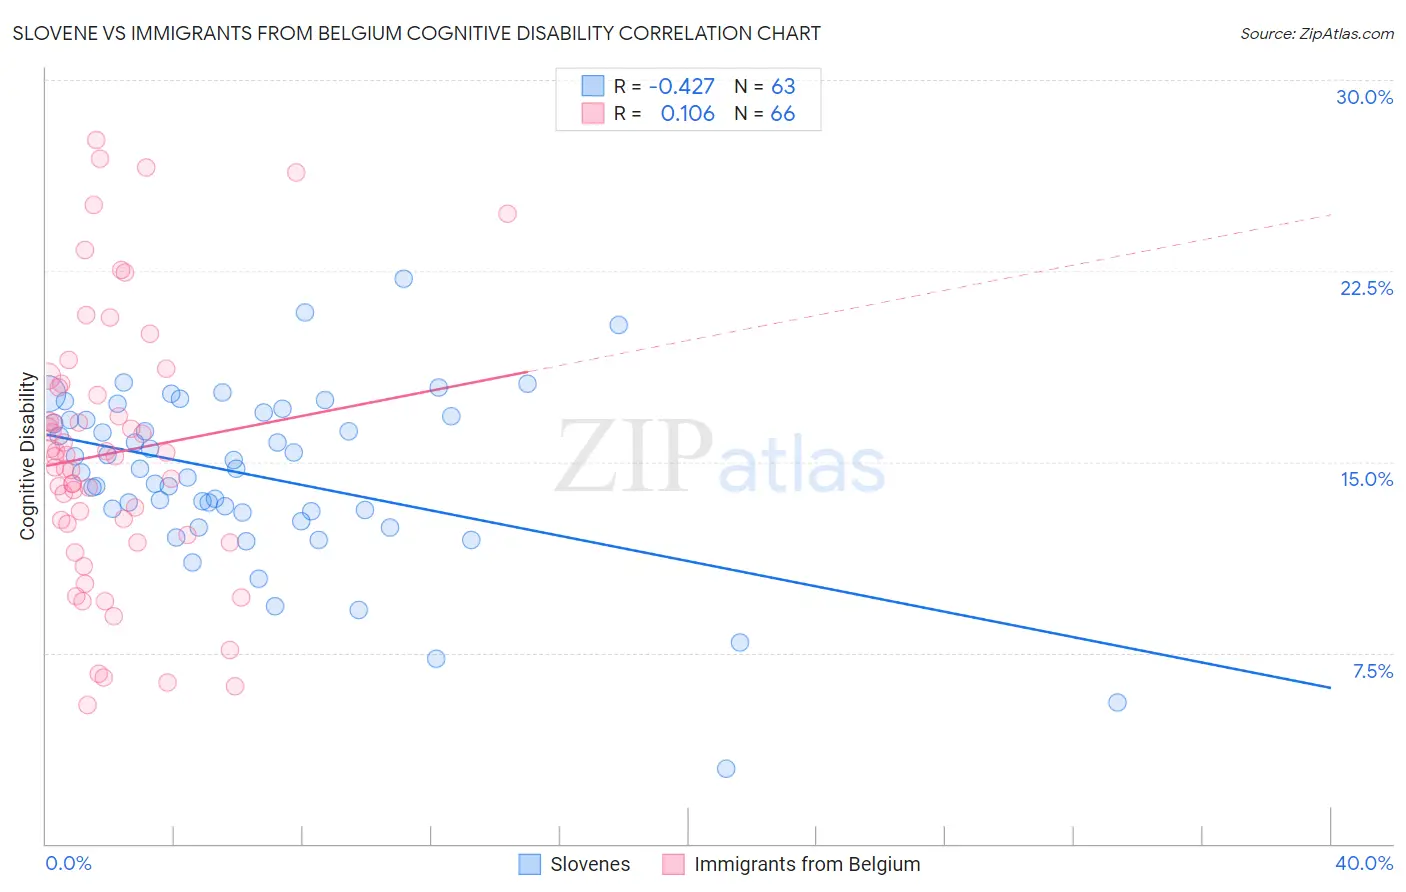
Slovene vs Immigrants from Belgium Cognitive Disability Correlation Chart

The statistical analysis conducted on geographies consisting of 261,350,780 people shows a moderate negative correlation between the proportion of Slovenes and percentage of population with cognitive disability in the United States with a correlation coefficient (R) of -0.427 and weighted average of 16.5%. Similarly, the statistical analysis conducted on geographies consisting of 146,717,963 people shows a poor positive correlation between the proportion of Immigrants from Belgium and percentage of population with cognitive disability in the United States with a correlation coefficient (R) of 0.106 and weighted average of 16.7%, a difference of 1.3%.
Slovene vs Immigrants from Belgium Cognitive Disability

Cognitive Disability Correlation Summary

MeasurementSloveneImmigrants from Belgium
Minimum2.9%5.4%
Maximum22.2%27.7%
Range19.2%22.2%
Mean14.4%15.3%
Median14.7%15.2%
Interquartile 25% (IQ1)13.0%12.2%
Interquartile 75% (IQ3)16.8%17.9%
Interquartile Range (IQR)3.8%5.8%
Standard Deviation (Sample)3.4%5.3%
Standard Deviation (Population)3.4%5.2%

Similar Demographics by Cognitive Disability

Demographics Similar to Slovenes by Cognitive Disability

In terms of cognitive disability, the demographic groups most similar to Slovenes are Immigrants from Eastern Europe (16.5%, a difference of 0.020%), Bolivian (16.5%, a difference of 0.090%), Immigrants from Belarus (16.5%, a difference of 0.10%), Cuban (16.5%, a difference of 0.11%), and Hungarian (16.5%, a difference of 0.12%).
DemographicsRating | RankCognitive Disability
Czechs
99.9
/100
|
#30
Exceptional
16.4%
Immigrants | Romania
99.9
/100
|
#31
Exceptional
16.4%
Immigrants | Israel
99.9
/100
|
#32
Exceptional
16.4%
Italians
99.9
/100
|
#33
Exceptional
16.4%
Russians
99.9
/100
|
#34
Exceptional
16.4%
Slovaks
99.9
/100
|
#35
Exceptional
16.4%
Greeks
99.9
/100
|
#36
Exceptional
16.4%
Slovenes
99.9
/100
|
#37
Exceptional
16.5%
Immigrants | Eastern Europe
99.9
/100
|
#38
Exceptional
16.5%
Bolivians
99.9
/100
|
#39
Exceptional
16.5%
Immigrants | Belarus
99.9
/100
|
#40
Exceptional
16.5%
Cubans
99.9
/100
|
#41
Exceptional
16.5%
Hungarians
99.9
/100
|
#42
Exceptional
16.5%
Immigrants | Canada
99.8
/100
|
#43
Exceptional
16.5%
Macedonians
99.8
/100
|
#44
Exceptional
16.5%

Demographics Similar to Immigrants from Belgium by Cognitive Disability

In terms of cognitive disability, the demographic groups most similar to Immigrants from Belgium are Immigrants from Sweden (16.7%, a difference of 0.010%), Immigrants from Uzbekistan (16.7%, a difference of 0.020%), German (16.7%, a difference of 0.020%), Burmese (16.7%, a difference of 0.020%), and Slavic (16.7%, a difference of 0.030%).
DemographicsRating | RankCognitive Disability
Venezuelans
99.6
/100
|
#64
Exceptional
16.6%
Colombians
99.6
/100
|
#65
Exceptional
16.6%
Immigrants | Ukraine
99.5
/100
|
#66
Exceptional
16.6%
Latvians
99.5
/100
|
#67
Exceptional
16.6%
Ukrainians
99.4
/100
|
#68
Exceptional
16.6%
Immigrants | Uzbekistan
99.4
/100
|
#69
Exceptional
16.7%
Immigrants | Sweden
99.4
/100
|
#70
Exceptional
16.7%
Immigrants | Belgium
99.3
/100
|
#71
Exceptional
16.7%
Germans
99.3
/100
|
#72
Exceptional
16.7%
Burmese
99.3
/100
|
#73
Exceptional
16.7%
Slavs
99.3
/100
|
#74
Exceptional
16.7%
Estonians
99.3
/100
|
#75
Exceptional
16.7%
Immigrants | Serbia
99.3
/100
|
#76
Exceptional
16.7%
Immigrants | Hungary
99.3
/100
|
#77
Exceptional
16.7%
Peruvians
99.3
/100
|
#78
Exceptional
16.7%