Cape Verdean vs Immigrants from Belgium Cognitive Disability
COMPARE
Cape Verdean
Immigrants from Belgium
Cognitive Disability
Cognitive Disability Comparison
Cape Verdeans
Immigrants from Belgium
19.2%
COGNITIVE DISABILITY
0.0/ 100
METRIC RATING
340th/ 347
METRIC RANK
16.7%
COGNITIVE DISABILITY
99.3/ 100
METRIC RATING
71st/ 347
METRIC RANK
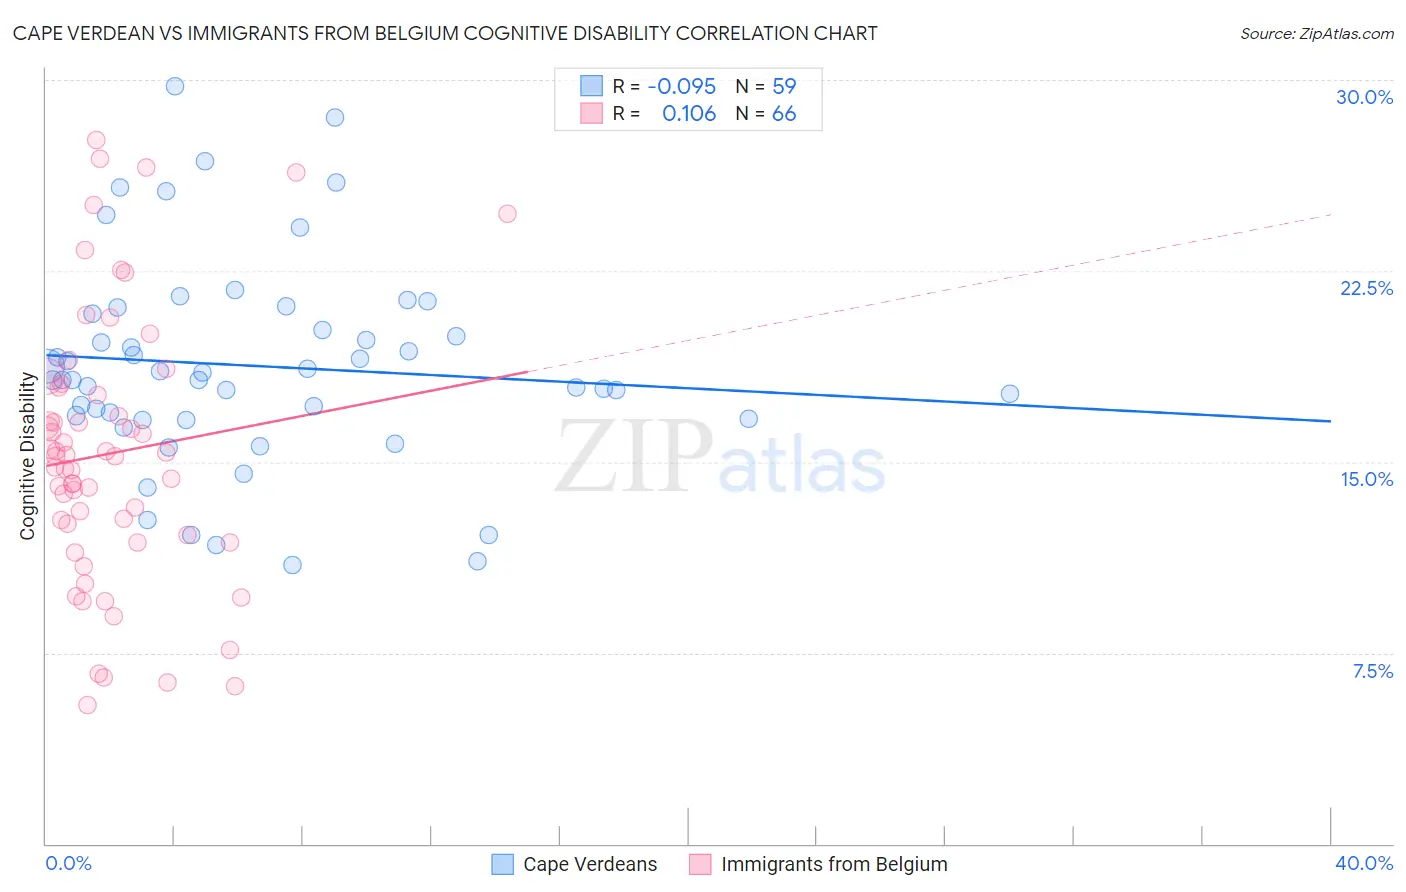
Cape Verdean vs Immigrants from Belgium Cognitive Disability Correlation Chart
The statistical analysis conducted on geographies consisting of 107,569,926 people shows a slight negative correlation between the proportion of Cape Verdeans and percentage of population with cognitive disability in the United States with a correlation coefficient (R) of -0.095 and weighted average of 19.2%. Similarly, the statistical analysis conducted on geographies consisting of 146,717,963 people shows a poor positive correlation between the proportion of Immigrants from Belgium and percentage of population with cognitive disability in the United States with a correlation coefficient (R) of 0.106 and weighted average of 16.7%, a difference of 15.3%.
Cognitive Disability Correlation Summary
| Measurement | Cape Verdean | Immigrants from Belgium |
| Minimum | 10.9% | 5.4% |
| Maximum | 29.8% | 27.7% |
| Range | 18.8% | 22.2% |
| Mean | 18.8% | 15.3% |
| Median | 18.2% | 15.2% |
| Interquartile 25% (IQ1) | 16.7% | 12.2% |
| Interquartile 75% (IQ3) | 20.8% | 17.9% |
| Interquartile Range (IQR) | 4.1% | 5.8% |
| Standard Deviation (Sample) | 4.0% | 5.3% |
| Standard Deviation (Population) | 4.0% | 5.2% |
Similar Demographics by Cognitive Disability
Demographics Similar to Cape Verdeans by Cognitive Disability
In terms of cognitive disability, the demographic groups most similar to Cape Verdeans are Puerto Rican (19.2%, a difference of 0.020%), Tohono O'odham (19.3%, a difference of 0.24%), Houma (19.3%, a difference of 0.24%), Lumbee (19.1%, a difference of 0.50%), and Immigrants from Saudi Arabia (19.1%, a difference of 0.84%).
| Demographics | Rating | Rank | Cognitive Disability |
| Immigrants | Yemen | 0.0 /100 | #333 | Tragic 18.8% |
| Sudanese | 0.0 /100 | #334 | Tragic 18.9% |
| Senegalese | 0.0 /100 | #335 | Tragic 19.0% |
| Blacks/African Americans | 0.0 /100 | #336 | Tragic 19.0% |
| Immigrants | Saudi Arabia | 0.0 /100 | #337 | Tragic 19.1% |
| Lumbee | 0.0 /100 | #338 | Tragic 19.1% |
| Puerto Ricans | 0.0 /100 | #339 | Tragic 19.2% |
| Cape Verdeans | 0.0 /100 | #340 | Tragic 19.2% |
| Tohono O'odham | 0.0 /100 | #341 | Tragic 19.3% |
| Houma | 0.0 /100 | #342 | Tragic 19.3% |
| Immigrants | Zaire | 0.0 /100 | #343 | Tragic 19.4% |
| Immigrants | Congo | 0.0 /100 | #344 | Tragic 19.7% |
| Somalis | 0.0 /100 | #345 | Tragic 19.8% |
| Immigrants | Cabo Verde | 0.0 /100 | #346 | Tragic 19.9% |
| Immigrants | Somalia | 0.0 /100 | #347 | Tragic 20.0% |
Demographics Similar to Immigrants from Belgium by Cognitive Disability
In terms of cognitive disability, the demographic groups most similar to Immigrants from Belgium are Immigrants from Sweden (16.7%, a difference of 0.010%), Immigrants from Uzbekistan (16.7%, a difference of 0.020%), German (16.7%, a difference of 0.020%), Burmese (16.7%, a difference of 0.020%), and Slavic (16.7%, a difference of 0.030%).
| Demographics | Rating | Rank | Cognitive Disability |
| Venezuelans | 99.6 /100 | #64 | Exceptional 16.6% |
| Colombians | 99.6 /100 | #65 | Exceptional 16.6% |
| Immigrants | Ukraine | 99.5 /100 | #66 | Exceptional 16.6% |
| Latvians | 99.5 /100 | #67 | Exceptional 16.6% |
| Ukrainians | 99.4 /100 | #68 | Exceptional 16.6% |
| Immigrants | Uzbekistan | 99.4 /100 | #69 | Exceptional 16.7% |
| Immigrants | Sweden | 99.4 /100 | #70 | Exceptional 16.7% |
| Immigrants | Belgium | 99.3 /100 | #71 | Exceptional 16.7% |
| Germans | 99.3 /100 | #72 | Exceptional 16.7% |
| Burmese | 99.3 /100 | #73 | Exceptional 16.7% |
| Slavs | 99.3 /100 | #74 | Exceptional 16.7% |
| Estonians | 99.3 /100 | #75 | Exceptional 16.7% |
| Immigrants | Serbia | 99.3 /100 | #76 | Exceptional 16.7% |
| Immigrants | Hungary | 99.3 /100 | #77 | Exceptional 16.7% |
| Peruvians | 99.3 /100 | #78 | Exceptional 16.7% |