Kenyan vs Immigrants from Albania 10th Grade
COMPARE
Kenyan
Immigrants from Albania
10th Grade
10th Grade Comparison
Kenyans
Immigrants from Albania
94.0%
10TH GRADE
79.1/ 100
METRIC RATING
151st/ 347
METRIC RANK
93.8%
10TH GRADE
52.4/ 100
METRIC RATING
171st/ 347
METRIC RANK
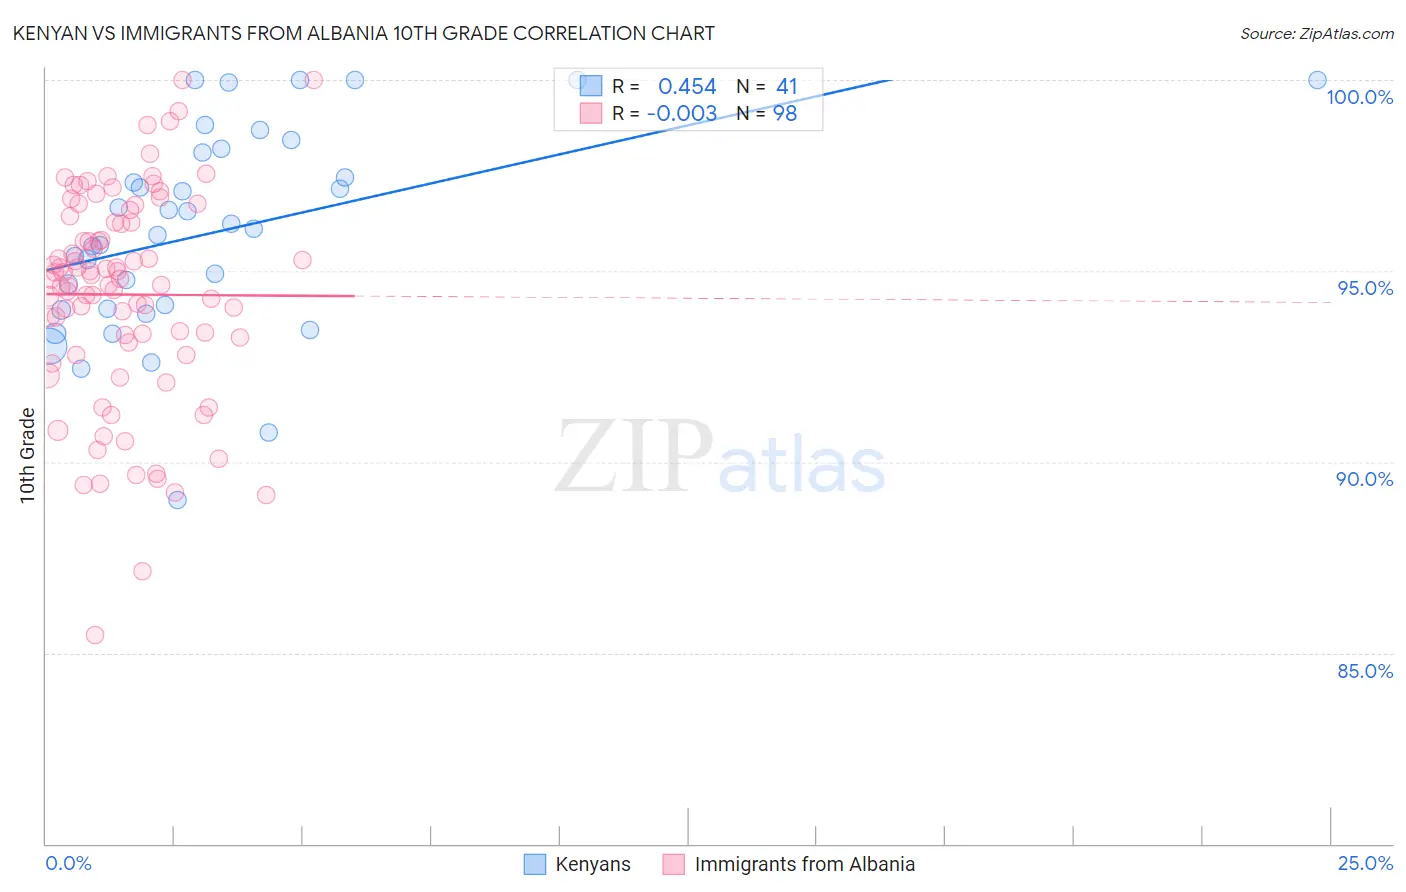
Kenyan vs Immigrants from Albania 10th Grade Correlation Chart
The statistical analysis conducted on geographies consisting of 168,244,042 people shows a moderate positive correlation between the proportion of Kenyans and percentage of population with at least 10th grade education in the United States with a correlation coefficient (R) of 0.454 and weighted average of 94.0%. Similarly, the statistical analysis conducted on geographies consisting of 119,309,649 people shows no correlation between the proportion of Immigrants from Albania and percentage of population with at least 10th grade education in the United States with a correlation coefficient (R) of -0.003 and weighted average of 93.8%, a difference of 0.28%.
10th Grade Correlation Summary
| Measurement | Kenyan | Immigrants from Albania |
| Minimum | 89.0% | 85.5% |
| Maximum | 100.0% | 100.0% |
| Range | 11.0% | 14.5% |
| Mean | 96.0% | 94.4% |
| Median | 96.1% | 94.8% |
| Interquartile 25% (IQ1) | 94.0% | 93.1% |
| Interquartile 75% (IQ3) | 98.2% | 96.3% |
| Interquartile Range (IQR) | 4.2% | 3.1% |
| Standard Deviation (Sample) | 2.7% | 2.8% |
| Standard Deviation (Population) | 2.6% | 2.8% |
Demographics Similar to Kenyans and Immigrants from Albania by 10th Grade
In terms of 10th grade, the demographic groups most similar to Kenyans are Immigrants from Italy (94.0%, a difference of 0.010%), Immigrants from Brazil (94.0%, a difference of 0.050%), Immigrants from Kenya (94.0%, a difference of 0.050%), Spanish (94.0%, a difference of 0.050%), and Mongolian (94.0%, a difference of 0.060%). Similarly, the demographic groups most similar to Immigrants from Albania are Immigrants from Venezuela (93.8%, a difference of 0.010%), Immigrants from Spain (93.8%, a difference of 0.030%), Alsatian (93.8%, a difference of 0.060%), Immigrants from Egypt (93.8%, a difference of 0.090%), and Brazilian (93.8%, a difference of 0.10%).
| Demographics | Rating | Rank | 10th Grade |
| Kenyans | 79.1 /100 | #151 | Good 94.0% |
| Immigrants | Italy | 78.0 /100 | #152 | Good 94.0% |
| Immigrants | Brazil | 75.5 /100 | #153 | Good 94.0% |
| Immigrants | Kenya | 75.3 /100 | #154 | Good 94.0% |
| Spanish | 74.9 /100 | #155 | Good 94.0% |
| Mongolians | 74.4 /100 | #156 | Good 94.0% |
| Kiowa | 73.3 /100 | #157 | Good 93.9% |
| Bermudans | 71.0 /100 | #158 | Good 93.9% |
| Chileans | 70.2 /100 | #159 | Good 93.9% |
| Pakistanis | 70.1 /100 | #160 | Good 93.9% |
| Assyrians/Chaldeans/Syriacs | 69.7 /100 | #161 | Good 93.9% |
| Immigrants | Poland | 69.6 /100 | #162 | Good 93.9% |
| Venezuelans | 69.5 /100 | #163 | Good 93.9% |
| Iraqis | 68.1 /100 | #164 | Good 93.9% |
| Brazilians | 63.6 /100 | #165 | Good 93.8% |
| Immigrants | Iraq | 63.0 /100 | #166 | Good 93.8% |
| Immigrants | Egypt | 62.3 /100 | #167 | Good 93.8% |
| Alsatians | 59.4 /100 | #168 | Average 93.8% |
| Immigrants | Spain | 55.9 /100 | #169 | Average 93.8% |
| Immigrants | Venezuela | 53.9 /100 | #170 | Average 93.8% |
| Immigrants | Albania | 52.4 /100 | #171 | Average 93.8% |