Immigrants from Senegal vs Malaysian Vision Disability
COMPARE
Immigrants from Senegal
Malaysian
Vision Disability
Vision Disability Comparison
Immigrants from Senegal
Malaysians
2.3%
VISION DISABILITY
3.8/ 100
METRIC RATING
222nd/ 347
METRIC RANK
2.3%
VISION DISABILITY
0.9/ 100
METRIC RATING
241st/ 347
METRIC RANK
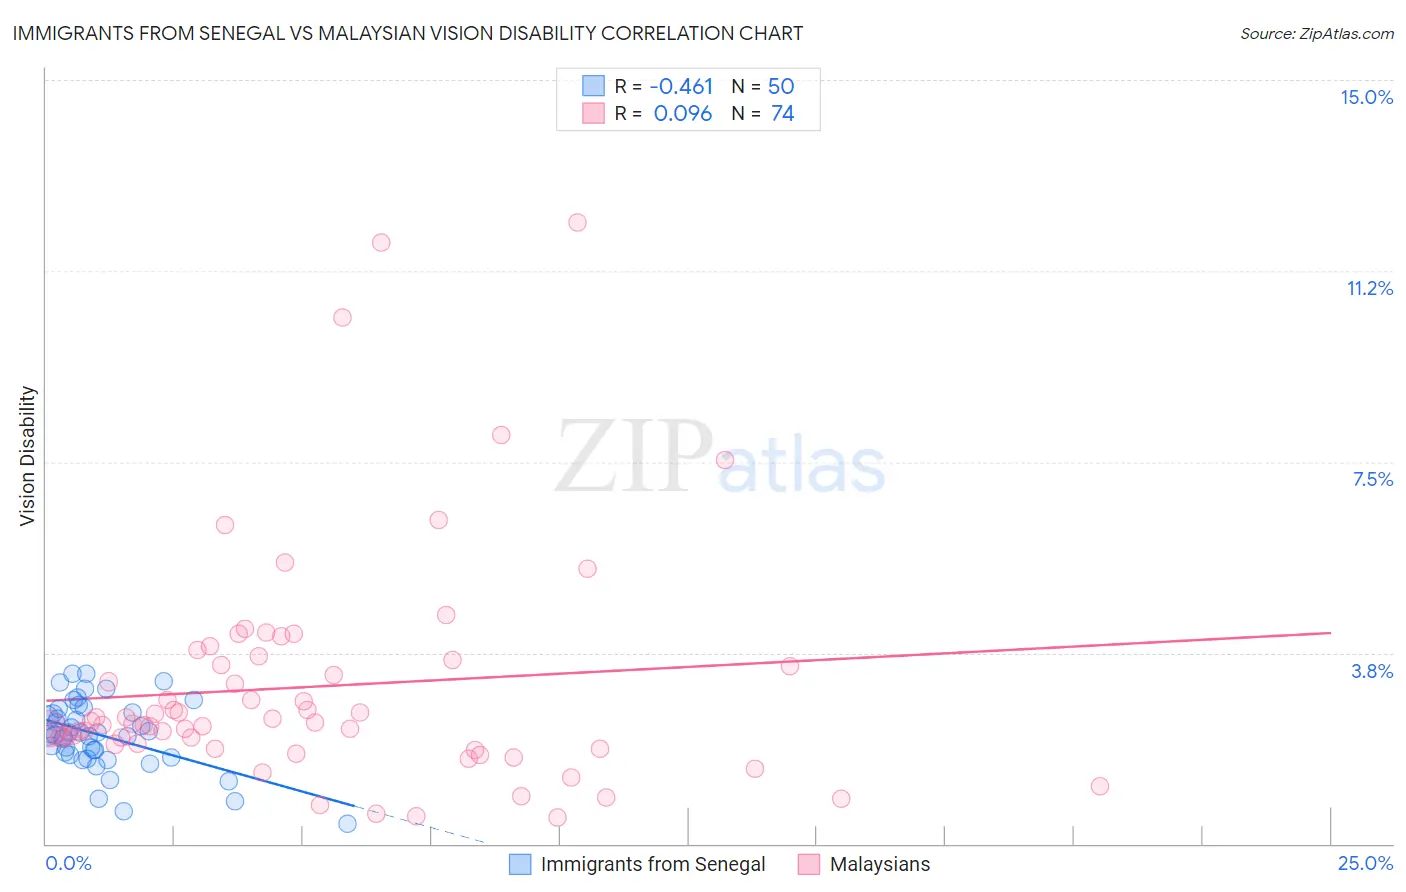
Immigrants from Senegal vs Malaysian Vision Disability Correlation Chart
The statistical analysis conducted on geographies consisting of 90,101,349 people shows a moderate negative correlation between the proportion of Immigrants from Senegal and percentage of population with vision disability in the United States with a correlation coefficient (R) of -0.461 and weighted average of 2.3%. Similarly, the statistical analysis conducted on geographies consisting of 226,017,600 people shows a slight positive correlation between the proportion of Malaysians and percentage of population with vision disability in the United States with a correlation coefficient (R) of 0.096 and weighted average of 2.3%, a difference of 2.2%.
Vision Disability Correlation Summary
| Measurement | Immigrants from Senegal | Malaysian |
| Minimum | 0.39% | 0.52% |
| Maximum | 3.3% | 12.2% |
| Range | 3.0% | 11.7% |
| Mean | 2.1% | 3.1% |
| Median | 2.2% | 2.4% |
| Interquartile 25% (IQ1) | 1.7% | 2.0% |
| Interquartile 75% (IQ3) | 2.6% | 3.6% |
| Interquartile Range (IQR) | 0.83% | 1.6% |
| Standard Deviation (Sample) | 0.68% | 2.3% |
| Standard Deviation (Population) | 0.67% | 2.3% |
Demographics Similar to Immigrants from Senegal and Malaysians by Vision Disability
In terms of vision disability, the demographic groups most similar to Immigrants from Senegal are French Canadian (2.3%, a difference of 0.020%), Basque (2.3%, a difference of 0.14%), Irish (2.3%, a difference of 0.17%), Immigrants from Western Africa (2.3%, a difference of 0.18%), and Immigrants from Germany (2.3%, a difference of 0.40%). Similarly, the demographic groups most similar to Malaysians are Panamanian (2.3%, a difference of 0.030%), English (2.3%, a difference of 0.29%), Immigrants from Cambodia (2.3%, a difference of 0.30%), Immigrants from Portugal (2.3%, a difference of 0.57%), and Immigrants from Congo (2.3%, a difference of 0.62%).
| Demographics | Rating | Rank | Vision Disability |
| French Canadians | 3.9 /100 | #221 | Tragic 2.3% |
| Immigrants | Senegal | 3.8 /100 | #222 | Tragic 2.3% |
| Basques | 3.5 /100 | #223 | Tragic 2.3% |
| Irish | 3.4 /100 | #224 | Tragic 2.3% |
| Immigrants | Western Africa | 3.4 /100 | #225 | Tragic 2.3% |
| Immigrants | Germany | 3.0 /100 | #226 | Tragic 2.3% |
| Hawaiians | 2.9 /100 | #227 | Tragic 2.3% |
| Hmong | 2.5 /100 | #228 | Tragic 2.3% |
| Welsh | 2.3 /100 | #229 | Tragic 2.3% |
| Nicaraguans | 2.2 /100 | #230 | Tragic 2.3% |
| Immigrants | Ecuador | 2.0 /100 | #231 | Tragic 2.3% |
| German Russians | 1.8 /100 | #232 | Tragic 2.3% |
| Central Americans | 1.8 /100 | #233 | Tragic 2.3% |
| Scottish | 1.6 /100 | #234 | Tragic 2.3% |
| Marshallese | 1.5 /100 | #235 | Tragic 2.3% |
| Immigrants | Congo | 1.4 /100 | #236 | Tragic 2.3% |
| Immigrants | Portugal | 1.4 /100 | #237 | Tragic 2.3% |
| Immigrants | Cambodia | 1.1 /100 | #238 | Tragic 2.3% |
| English | 1.1 /100 | #239 | Tragic 2.3% |
| Panamanians | 0.9 /100 | #240 | Tragic 2.3% |
| Malaysians | 0.9 /100 | #241 | Tragic 2.3% |