Immigrants from Ethiopia vs Malaysian Vision Disability
COMPARE
Immigrants from Ethiopia
Malaysian
Vision Disability
Vision Disability Comparison
Immigrants from Ethiopia
Malaysians
2.0%
VISION DISABILITY
99.7/ 100
METRIC RATING
42nd/ 347
METRIC RANK
2.3%
VISION DISABILITY
0.9/ 100
METRIC RATING
241st/ 347
METRIC RANK
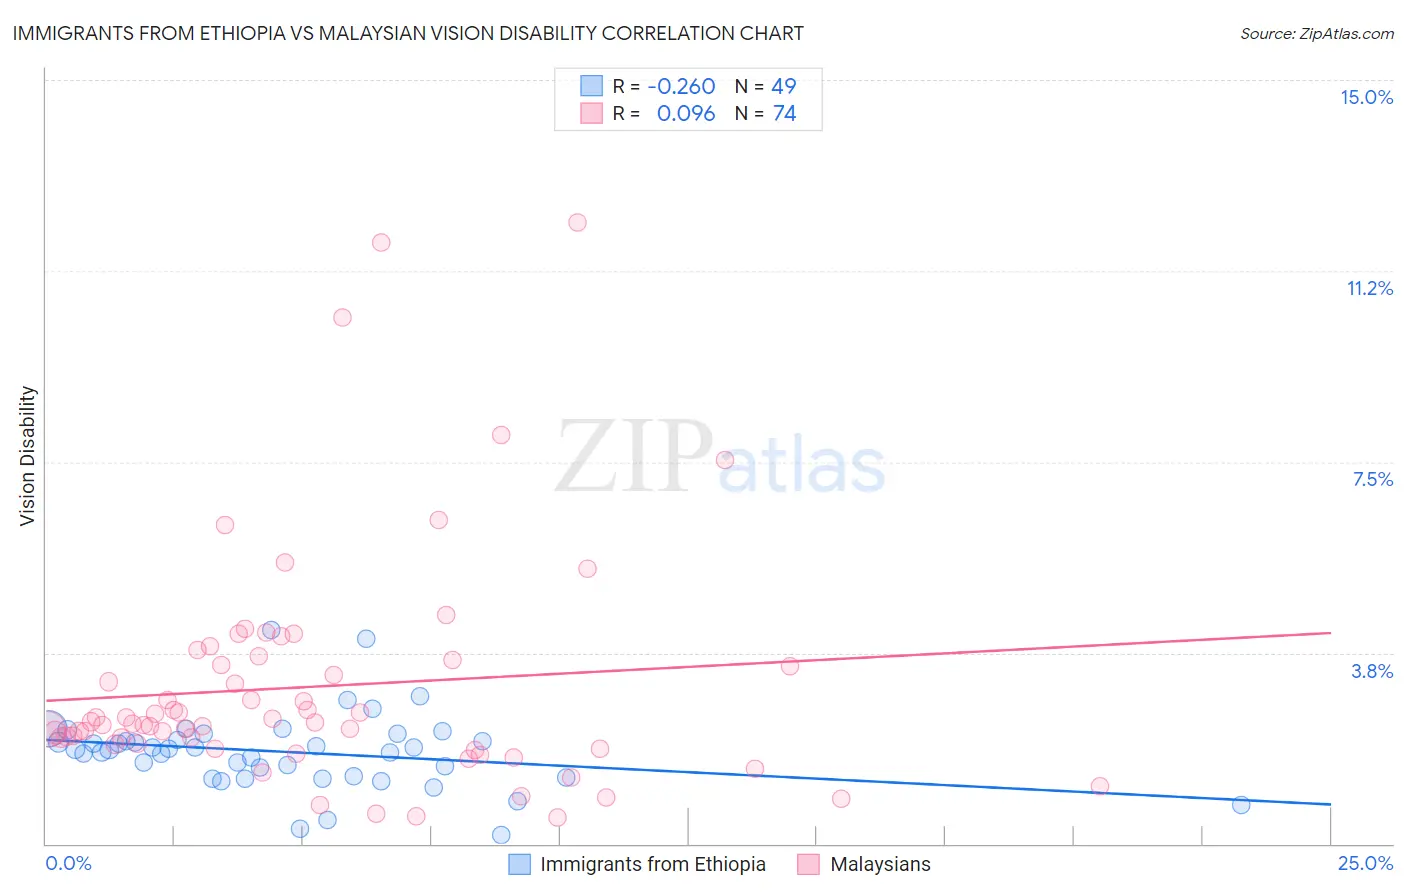
Immigrants from Ethiopia vs Malaysian Vision Disability Correlation Chart
The statistical analysis conducted on geographies consisting of 211,444,224 people shows a weak negative correlation between the proportion of Immigrants from Ethiopia and percentage of population with vision disability in the United States with a correlation coefficient (R) of -0.260 and weighted average of 2.0%. Similarly, the statistical analysis conducted on geographies consisting of 226,017,600 people shows a slight positive correlation between the proportion of Malaysians and percentage of population with vision disability in the United States with a correlation coefficient (R) of 0.096 and weighted average of 2.3%, a difference of 18.1%.
Vision Disability Correlation Summary
| Measurement | Immigrants from Ethiopia | Malaysian |
| Minimum | 0.17% | 0.52% |
| Maximum | 4.2% | 12.2% |
| Range | 4.0% | 11.7% |
| Mean | 1.8% | 3.1% |
| Median | 1.9% | 2.4% |
| Interquartile 25% (IQ1) | 1.3% | 2.0% |
| Interquartile 75% (IQ3) | 2.1% | 3.6% |
| Interquartile Range (IQR) | 0.79% | 1.6% |
| Standard Deviation (Sample) | 0.74% | 2.3% |
| Standard Deviation (Population) | 0.74% | 2.3% |
Similar Demographics by Vision Disability
Demographics Similar to Immigrants from Ethiopia by Vision Disability
In terms of vision disability, the demographic groups most similar to Immigrants from Ethiopia are Eastern European (2.0%, a difference of 0.060%), Immigrants from Indonesia (2.0%, a difference of 0.090%), Ethiopian (2.0%, a difference of 0.11%), Immigrants from Sweden (2.0%, a difference of 0.15%), and Cypriot (2.0%, a difference of 0.16%).
| Demographics | Rating | Rank | Vision Disability |
| Immigrants | Australia | 99.8 /100 | #35 | Exceptional 1.9% |
| Cambodians | 99.8 /100 | #36 | Exceptional 2.0% |
| Bhutanese | 99.8 /100 | #37 | Exceptional 2.0% |
| Immigrants | Kuwait | 99.8 /100 | #38 | Exceptional 2.0% |
| Zimbabweans | 99.7 /100 | #39 | Exceptional 2.0% |
| Immigrants | Ireland | 99.7 /100 | #40 | Exceptional 2.0% |
| Cypriots | 99.7 /100 | #41 | Exceptional 2.0% |
| Immigrants | Ethiopia | 99.7 /100 | #42 | Exceptional 2.0% |
| Eastern Europeans | 99.7 /100 | #43 | Exceptional 2.0% |
| Immigrants | Indonesia | 99.7 /100 | #44 | Exceptional 2.0% |
| Ethiopians | 99.7 /100 | #45 | Exceptional 2.0% |
| Immigrants | Sweden | 99.7 /100 | #46 | Exceptional 2.0% |
| Immigrants | Bulgaria | 99.7 /100 | #47 | Exceptional 2.0% |
| Israelis | 99.6 /100 | #48 | Exceptional 2.0% |
| Latvians | 99.5 /100 | #49 | Exceptional 2.0% |
Demographics Similar to Malaysians by Vision Disability
In terms of vision disability, the demographic groups most similar to Malaysians are Panamanian (2.3%, a difference of 0.030%), Immigrants from Panama (2.3%, a difference of 0.14%), English (2.3%, a difference of 0.29%), Immigrants from Cambodia (2.3%, a difference of 0.30%), and Immigrants from Portugal (2.3%, a difference of 0.57%).
| Demographics | Rating | Rank | Vision Disability |
| Scottish | 1.6 /100 | #234 | Tragic 2.3% |
| Marshallese | 1.5 /100 | #235 | Tragic 2.3% |
| Immigrants | Congo | 1.4 /100 | #236 | Tragic 2.3% |
| Immigrants | Portugal | 1.4 /100 | #237 | Tragic 2.3% |
| Immigrants | Cambodia | 1.1 /100 | #238 | Tragic 2.3% |
| English | 1.1 /100 | #239 | Tragic 2.3% |
| Panamanians | 0.9 /100 | #240 | Tragic 2.3% |
| Malaysians | 0.9 /100 | #241 | Tragic 2.3% |
| Immigrants | Panama | 0.8 /100 | #242 | Tragic 2.3% |
| Immigrants | Nicaragua | 0.6 /100 | #243 | Tragic 2.3% |
| Immigrants | West Indies | 0.6 /100 | #244 | Tragic 2.3% |
| Alsatians | 0.6 /100 | #245 | Tragic 2.3% |
| French | 0.5 /100 | #246 | Tragic 2.3% |
| Guatemalans | 0.5 /100 | #247 | Tragic 2.3% |
| Sub-Saharan Africans | 0.5 /100 | #248 | Tragic 2.3% |