Japanese vs Guatemalan Disability Age 65 to 74
COMPARE
Japanese
Guatemalan
Disability Age 65 to 74
Disability Age 65 to 74 Comparison
Japanese
Guatemalans
25.7%
DISABILITY AGE 65 TO 74
0.1/ 100
METRIC RATING
273rd/ 347
METRIC RANK
25.5%
DISABILITY AGE 65 TO 74
0.2/ 100
METRIC RATING
265th/ 347
METRIC RANK
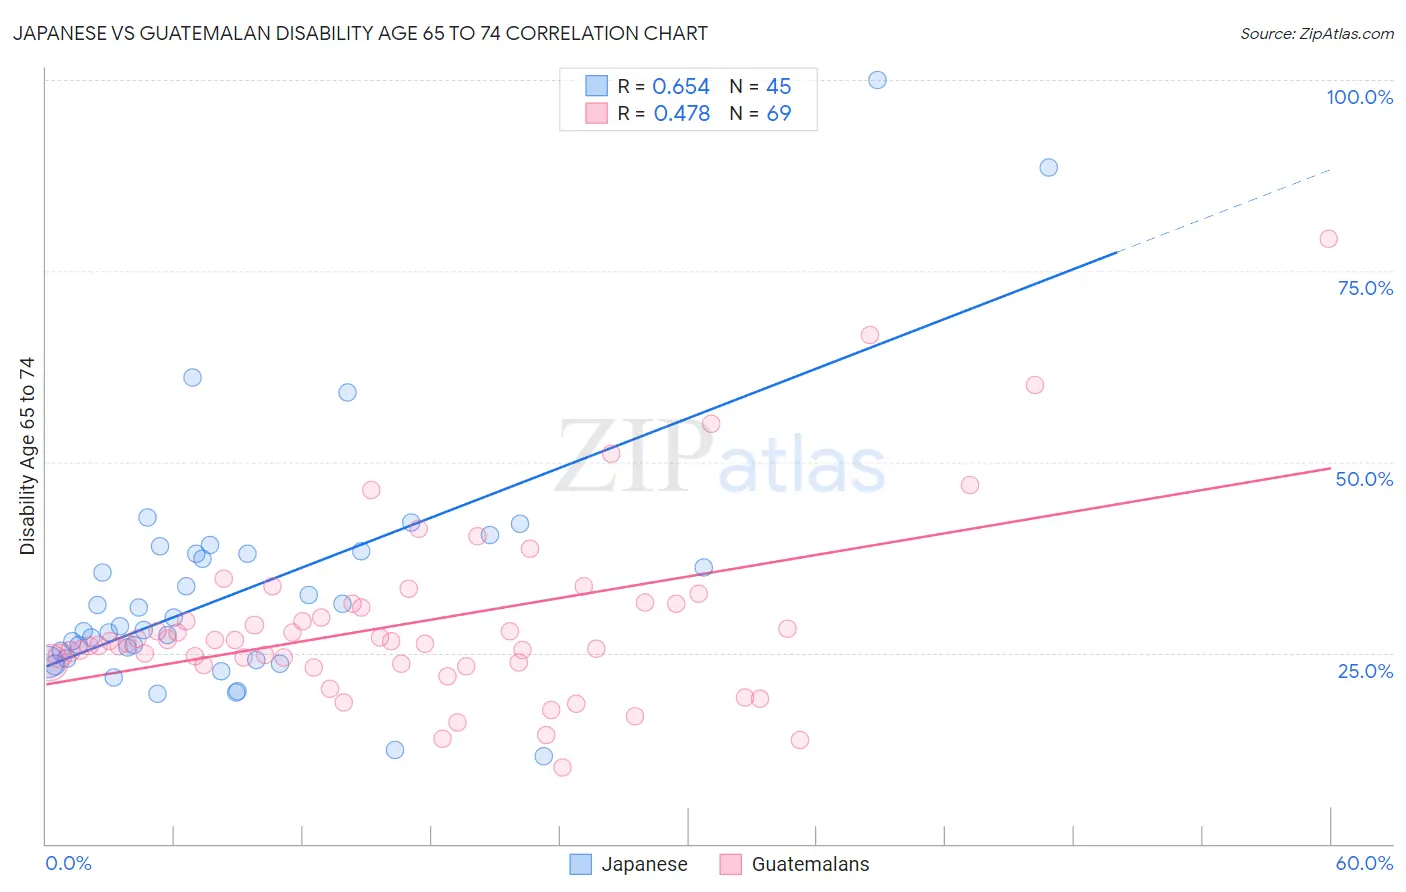
Japanese vs Guatemalan Disability Age 65 to 74 Correlation Chart
The statistical analysis conducted on geographies consisting of 248,828,802 people shows a significant positive correlation between the proportion of Japanese and percentage of population with a disability between the ages 65 and 75 in the United States with a correlation coefficient (R) of 0.654 and weighted average of 25.7%. Similarly, the statistical analysis conducted on geographies consisting of 408,717,949 people shows a moderate positive correlation between the proportion of Guatemalans and percentage of population with a disability between the ages 65 and 75 in the United States with a correlation coefficient (R) of 0.478 and weighted average of 25.5%, a difference of 0.69%.
Disability Age 65 to 74 Correlation Summary
| Measurement | Japanese | Guatemalan |
| Minimum | 11.5% | 10.0% |
| Maximum | 100.0% | 79.2% |
| Range | 88.5% | 69.2% |
| Mean | 33.5% | 29.0% |
| Median | 28.5% | 26.6% |
| Interquartile 25% (IQ1) | 24.2% | 23.6% |
| Interquartile 75% (IQ3) | 38.1% | 31.4% |
| Interquartile Range (IQR) | 13.9% | 7.8% |
| Standard Deviation (Sample) | 16.5% | 11.9% |
| Standard Deviation (Population) | 16.4% | 11.9% |
Demographics Similar to Japanese and Guatemalans by Disability Age 65 to 74
In terms of disability age 65 to 74, the demographic groups most similar to Japanese are Immigrants from Liberia (25.7%, a difference of 0.13%), Immigrants from Dominica (25.7%, a difference of 0.13%), Immigrants from Guatemala (25.7%, a difference of 0.16%), Hmong (25.7%, a difference of 0.24%), and American (25.8%, a difference of 0.33%). Similarly, the demographic groups most similar to Guatemalans are Hawaiian (25.5%, a difference of 0.050%), Immigrants from Latin America (25.6%, a difference of 0.080%), Ottawa (25.6%, a difference of 0.23%), Liberian (25.6%, a difference of 0.33%), and Iroquois (25.4%, a difference of 0.39%).
| Demographics | Rating | Rank | Disability Age 65 to 74 |
| Immigrants | Cambodia | 0.3 /100 | #259 | Tragic 25.3% |
| Malaysians | 0.2 /100 | #260 | Tragic 25.4% |
| Cape Verdeans | 0.2 /100 | #261 | Tragic 25.4% |
| Samoans | 0.2 /100 | #262 | Tragic 25.4% |
| Iroquois | 0.2 /100 | #263 | Tragic 25.4% |
| Hawaiians | 0.2 /100 | #264 | Tragic 25.5% |
| Guatemalans | 0.2 /100 | #265 | Tragic 25.5% |
| Immigrants | Latin America | 0.1 /100 | #266 | Tragic 25.6% |
| Ottawa | 0.1 /100 | #267 | Tragic 25.6% |
| Liberians | 0.1 /100 | #268 | Tragic 25.6% |
| Hmong | 0.1 /100 | #269 | Tragic 25.7% |
| Immigrants | Guatemala | 0.1 /100 | #270 | Tragic 25.7% |
| Immigrants | Liberia | 0.1 /100 | #271 | Tragic 25.7% |
| Immigrants | Dominica | 0.1 /100 | #272 | Tragic 25.7% |
| Japanese | 0.1 /100 | #273 | Tragic 25.7% |
| Americans | 0.1 /100 | #274 | Tragic 25.8% |
| Hondurans | 0.1 /100 | #275 | Tragic 25.8% |
| French American Indians | 0.1 /100 | #276 | Tragic 25.8% |
| Belizeans | 0.1 /100 | #277 | Tragic 25.8% |
| Immigrants | Belize | 0.1 /100 | #278 | Tragic 25.8% |
| U.S. Virgin Islanders | 0.1 /100 | #279 | Tragic 25.9% |