Japanese vs Immigrants from Congo Disability Age Over 75
COMPARE
Japanese
Immigrants from Congo
Disability Age Over 75
Disability Age Over 75 Comparison
Japanese
Immigrants from Congo
50.2%
DISABILITY AGE OVER 75
0.0/ 100
METRIC RATING
303rd/ 347
METRIC RANK
48.7%
DISABILITY AGE OVER 75
0.5/ 100
METRIC RATING
256th/ 347
METRIC RANK
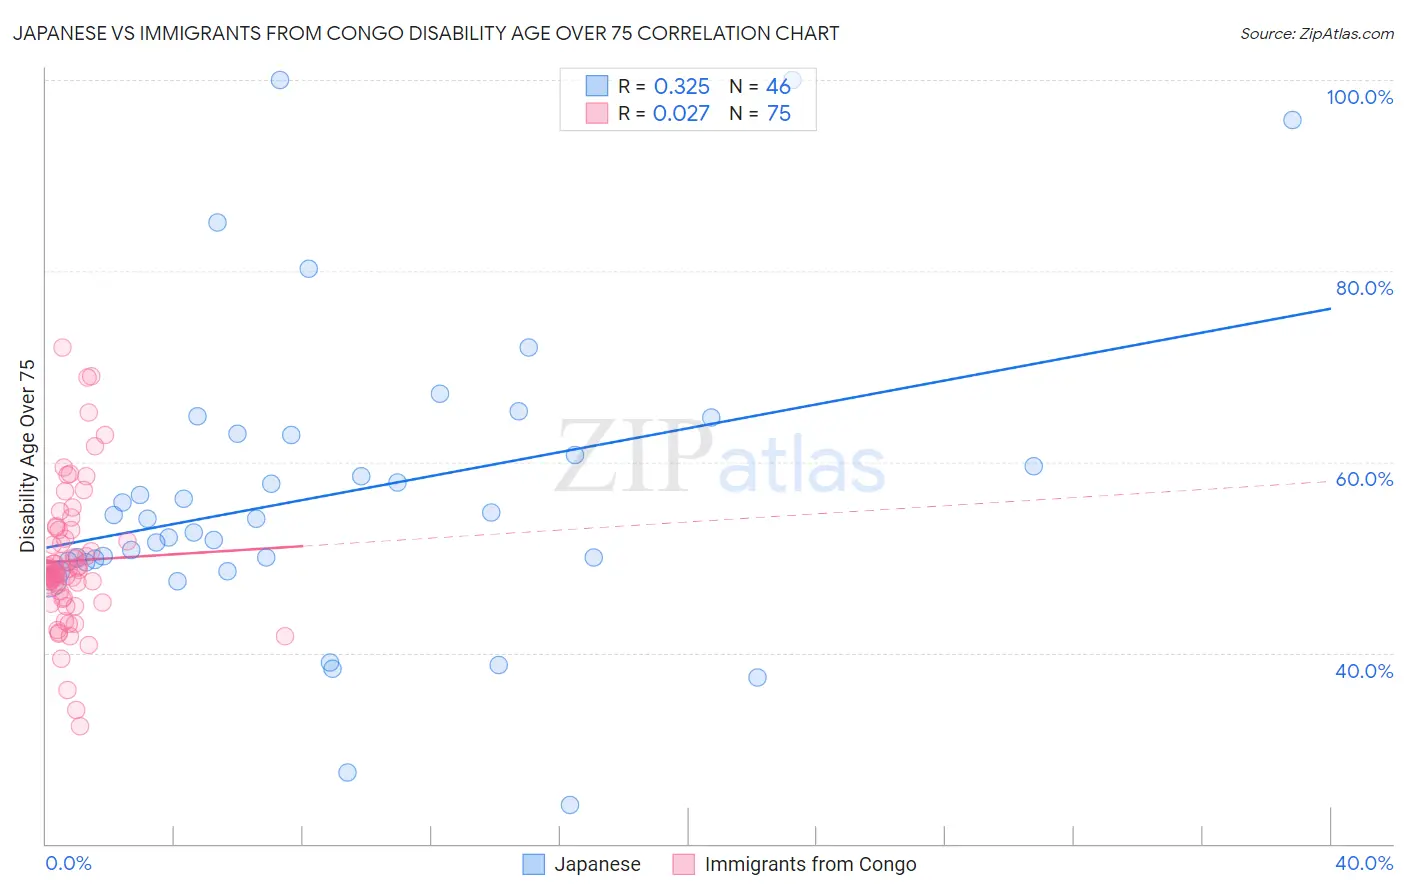
Japanese vs Immigrants from Congo Disability Age Over 75 Correlation Chart
The statistical analysis conducted on geographies consisting of 248,861,887 people shows a mild positive correlation between the proportion of Japanese and percentage of population with a disability over the age of 75 in the United States with a correlation coefficient (R) of 0.325 and weighted average of 50.2%. Similarly, the statistical analysis conducted on geographies consisting of 92,072,381 people shows no correlation between the proportion of Immigrants from Congo and percentage of population with a disability over the age of 75 in the United States with a correlation coefficient (R) of 0.027 and weighted average of 48.7%, a difference of 3.1%.
Disability Age Over 75 Correlation Summary
| Measurement | Japanese | Immigrants from Congo |
| Minimum | 24.0% | 32.4% |
| Maximum | 100.0% | 72.0% |
| Range | 76.0% | 39.6% |
| Mean | 56.6% | 49.6% |
| Median | 54.0% | 48.6% |
| Interquartile 25% (IQ1) | 49.6% | 45.7% |
| Interquartile 75% (IQ3) | 62.8% | 52.8% |
| Interquartile Range (IQR) | 13.3% | 7.1% |
| Standard Deviation (Sample) | 15.9% | 7.3% |
| Standard Deviation (Population) | 15.7% | 7.2% |
Similar Demographics by Disability Age Over 75
Demographics Similar to Japanese by Disability Age Over 75
In terms of disability age over 75, the demographic groups most similar to Japanese are Cherokee (50.2%, a difference of 0.010%), Immigrants from Dominican Republic (50.3%, a difference of 0.11%), Dominican (50.2%, a difference of 0.17%), Cape Verdean (50.1%, a difference of 0.23%), and Immigrants from Micronesia (50.1%, a difference of 0.26%).
| Demographics | Rating | Rank | Disability Age Over 75 |
| Mexican American Indians | 0.0 /100 | #296 | Tragic 50.0% |
| Armenians | 0.0 /100 | #297 | Tragic 50.0% |
| Marshallese | 0.0 /100 | #298 | Tragic 50.1% |
| Immigrants | Micronesia | 0.0 /100 | #299 | Tragic 50.1% |
| Cape Verdeans | 0.0 /100 | #300 | Tragic 50.1% |
| Dominicans | 0.0 /100 | #301 | Tragic 50.2% |
| Cherokee | 0.0 /100 | #302 | Tragic 50.2% |
| Japanese | 0.0 /100 | #303 | Tragic 50.2% |
| Immigrants | Dominican Republic | 0.0 /100 | #304 | Tragic 50.3% |
| Central American Indians | 0.0 /100 | #305 | Tragic 50.5% |
| Immigrants | Central America | 0.0 /100 | #306 | Tragic 50.5% |
| Immigrants | Fiji | 0.0 /100 | #307 | Tragic 50.6% |
| Hispanics or Latinos | 0.0 /100 | #308 | Tragic 50.6% |
| Aleuts | 0.0 /100 | #309 | Tragic 50.6% |
| Tlingit-Haida | 0.0 /100 | #310 | Tragic 50.6% |
Demographics Similar to Immigrants from Congo by Disability Age Over 75
In terms of disability age over 75, the demographic groups most similar to Immigrants from Congo are Chinese (48.7%, a difference of 0.010%), Immigrants from Vietnam (48.7%, a difference of 0.050%), Blackfeet (48.8%, a difference of 0.050%), British West Indian (48.7%, a difference of 0.080%), and Immigrants from Philippines (48.8%, a difference of 0.090%).
| Demographics | Rating | Rank | Disability Age Over 75 |
| Iraqis | 1.0 /100 | #249 | Tragic 48.6% |
| West Indians | 0.8 /100 | #250 | Tragic 48.6% |
| Koreans | 0.8 /100 | #251 | Tragic 48.6% |
| Immigrants | South Eastern Asia | 0.7 /100 | #252 | Tragic 48.7% |
| British West Indians | 0.6 /100 | #253 | Tragic 48.7% |
| Immigrants | Vietnam | 0.6 /100 | #254 | Tragic 48.7% |
| Chinese | 0.5 /100 | #255 | Tragic 48.7% |
| Immigrants | Congo | 0.5 /100 | #256 | Tragic 48.7% |
| Blackfeet | 0.5 /100 | #257 | Tragic 48.8% |
| Immigrants | Philippines | 0.4 /100 | #258 | Tragic 48.8% |
| Central Americans | 0.4 /100 | #259 | Tragic 48.8% |
| Immigrants | Afghanistan | 0.4 /100 | #260 | Tragic 48.8% |
| Africans | 0.3 /100 | #261 | Tragic 48.9% |
| Immigrants | West Indies | 0.3 /100 | #262 | Tragic 48.9% |
| Salvadorans | 0.3 /100 | #263 | Tragic 48.9% |