Bangladeshi vs Cambodian Male Disability
COMPARE
Bangladeshi
Cambodian
Male Disability
Male Disability Comparison
Bangladeshis
Cambodians
12.0%
MALE DISABILITY
0.5/ 100
METRIC RATING
250th/ 347
METRIC RANK
10.3%
MALE DISABILITY
99.7/ 100
METRIC RATING
46th/ 347
METRIC RANK
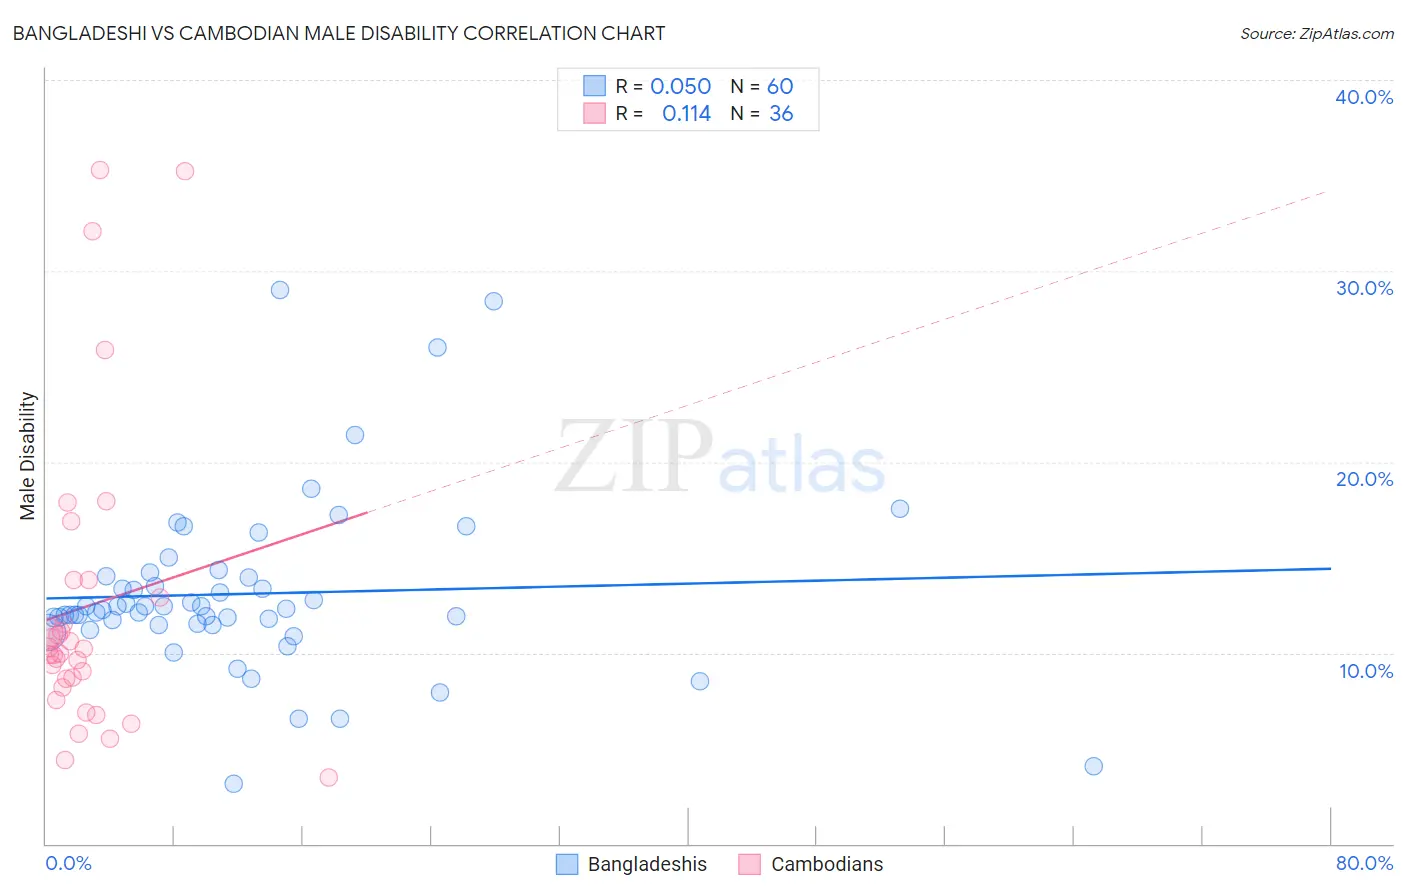
Bangladeshi vs Cambodian Male Disability Correlation Chart
The statistical analysis conducted on geographies consisting of 141,384,534 people shows a slight positive correlation between the proportion of Bangladeshis and percentage of males with a disability in the United States with a correlation coefficient (R) of 0.050 and weighted average of 12.0%. Similarly, the statistical analysis conducted on geographies consisting of 102,516,296 people shows a poor positive correlation between the proportion of Cambodians and percentage of males with a disability in the United States with a correlation coefficient (R) of 0.114 and weighted average of 10.3%, a difference of 16.7%.
Male Disability Correlation Summary
| Measurement | Bangladeshi | Cambodian |
| Minimum | 3.2% | 3.5% |
| Maximum | 29.0% | 35.3% |
| Range | 25.8% | 31.8% |
| Mean | 13.1% | 12.4% |
| Median | 12.3% | 10.1% |
| Interquartile 25% (IQ1) | 11.5% | 8.4% |
| Interquartile 75% (IQ3) | 14.0% | 13.4% |
| Interquartile Range (IQR) | 2.5% | 4.9% |
| Standard Deviation (Sample) | 4.6% | 7.9% |
| Standard Deviation (Population) | 4.6% | 7.8% |
Similar Demographics by Male Disability
Demographics Similar to Bangladeshis by Male Disability
In terms of male disability, the demographic groups most similar to Bangladeshis are German Russian (12.0%, a difference of 0.010%), Immigrants from Yemen (12.0%, a difference of 0.050%), Slovene (12.0%, a difference of 0.080%), Guamanian/Chamorro (12.0%, a difference of 0.080%), and British (12.1%, a difference of 0.27%).
| Demographics | Rating | Rank | Male Disability |
| Samoans | 1.1 /100 | #243 | Tragic 11.9% |
| Immigrants | Laos | 1.0 /100 | #244 | Tragic 11.9% |
| Immigrants | Liberia | 1.0 /100 | #245 | Tragic 11.9% |
| Danes | 0.9 /100 | #246 | Tragic 11.9% |
| Hungarians | 0.8 /100 | #247 | Tragic 12.0% |
| Poles | 0.7 /100 | #248 | Tragic 12.0% |
| Immigrants | Yemen | 0.5 /100 | #249 | Tragic 12.0% |
| Bangladeshis | 0.5 /100 | #250 | Tragic 12.0% |
| German Russians | 0.5 /100 | #251 | Tragic 12.0% |
| Slovenes | 0.5 /100 | #252 | Tragic 12.0% |
| Guamanians/Chamorros | 0.5 /100 | #253 | Tragic 12.0% |
| British | 0.4 /100 | #254 | Tragic 12.1% |
| Chinese | 0.4 /100 | #255 | Tragic 12.1% |
| Swiss | 0.3 /100 | #256 | Tragic 12.1% |
| Europeans | 0.3 /100 | #257 | Tragic 12.1% |
Demographics Similar to Cambodians by Male Disability
In terms of male disability, the demographic groups most similar to Cambodians are Immigrants from Peru (10.3%, a difference of 0.040%), Israeli (10.3%, a difference of 0.070%), Turkish (10.3%, a difference of 0.080%), Immigrants from El Salvador (10.3%, a difference of 0.090%), and Immigrants from Spain (10.3%, a difference of 0.13%).
| Demographics | Rating | Rank | Male Disability |
| Afghans | 99.8 /100 | #39 | Exceptional 10.2% |
| Immigrants | Nepal | 99.8 /100 | #40 | Exceptional 10.3% |
| Taiwanese | 99.8 /100 | #41 | Exceptional 10.3% |
| Mongolians | 99.7 /100 | #42 | Exceptional 10.3% |
| Immigrants | Bangladesh | 99.7 /100 | #43 | Exceptional 10.3% |
| Immigrants | El Salvador | 99.7 /100 | #44 | Exceptional 10.3% |
| Turks | 99.7 /100 | #45 | Exceptional 10.3% |
| Cambodians | 99.7 /100 | #46 | Exceptional 10.3% |
| Immigrants | Peru | 99.7 /100 | #47 | Exceptional 10.3% |
| Israelis | 99.7 /100 | #48 | Exceptional 10.3% |
| Immigrants | Spain | 99.7 /100 | #49 | Exceptional 10.3% |
| South Americans | 99.6 /100 | #50 | Exceptional 10.3% |
| Salvadorans | 99.6 /100 | #51 | Exceptional 10.4% |
| Immigrants | Saudi Arabia | 99.6 /100 | #52 | Exceptional 10.4% |
| Immigrants | Uzbekistan | 99.6 /100 | #53 | Exceptional 10.4% |