Immigrants from Serbia vs Immigrants from Spain Cognitive Disability
COMPARE
Immigrants from Serbia
Immigrants from Spain
Cognitive Disability
Cognitive Disability Comparison
Immigrants from Serbia
Immigrants from Spain
16.7%
COGNITIVE DISABILITY
99.3/ 100
METRIC RATING
76th/ 347
METRIC RANK
17.4%
COGNITIVE DISABILITY
27.7/ 100
METRIC RATING
190th/ 347
METRIC RANK
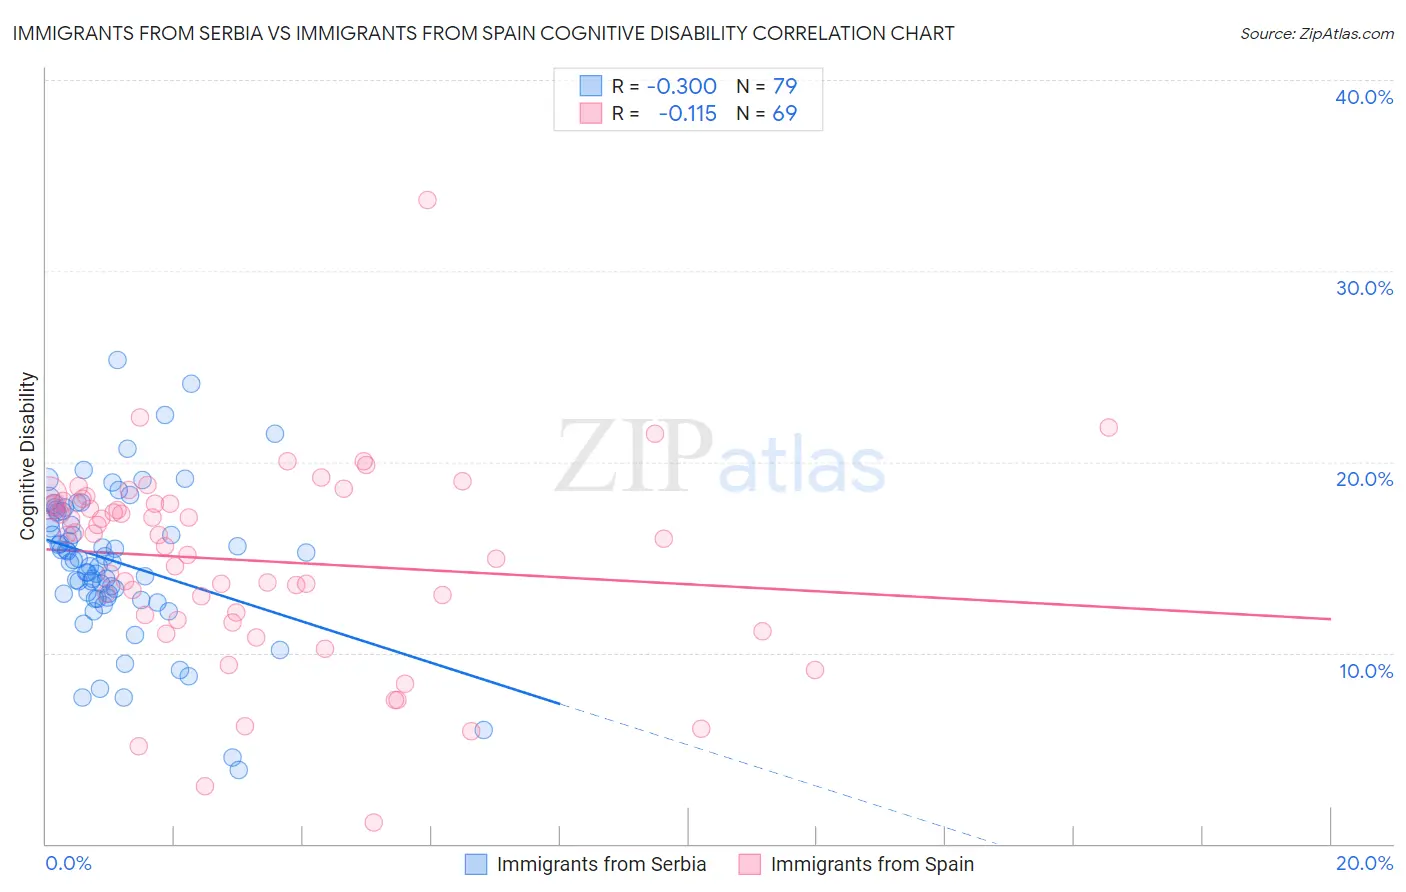
Immigrants from Serbia vs Immigrants from Spain Cognitive Disability Correlation Chart
The statistical analysis conducted on geographies consisting of 131,747,829 people shows a mild negative correlation between the proportion of Immigrants from Serbia and percentage of population with cognitive disability in the United States with a correlation coefficient (R) of -0.300 and weighted average of 16.7%. Similarly, the statistical analysis conducted on geographies consisting of 239,684,126 people shows a poor negative correlation between the proportion of Immigrants from Spain and percentage of population with cognitive disability in the United States with a correlation coefficient (R) of -0.115 and weighted average of 17.4%, a difference of 4.3%.
Cognitive Disability Correlation Summary
| Measurement | Immigrants from Serbia | Immigrants from Spain |
| Minimum | 3.9% | 1.1% |
| Maximum | 25.3% | 33.7% |
| Range | 21.5% | 32.6% |
| Mean | 14.8% | 14.8% |
| Median | 14.9% | 16.2% |
| Interquartile 25% (IQ1) | 12.9% | 11.9% |
| Interquartile 75% (IQ3) | 17.4% | 17.9% |
| Interquartile Range (IQR) | 4.5% | 6.0% |
| Standard Deviation (Sample) | 3.9% | 5.2% |
| Standard Deviation (Population) | 3.9% | 5.1% |
Similar Demographics by Cognitive Disability
Demographics Similar to Immigrants from Serbia by Cognitive Disability
In terms of cognitive disability, the demographic groups most similar to Immigrants from Serbia are Immigrants from Hungary (16.7%, a difference of 0.010%), Peruvian (16.7%, a difference of 0.010%), Estonian (16.7%, a difference of 0.020%), Immigrants from Bulgaria (16.7%, a difference of 0.020%), and Burmese (16.7%, a difference of 0.030%).
| Demographics | Rating | Rank | Cognitive Disability |
| Immigrants | Uzbekistan | 99.4 /100 | #69 | Exceptional 16.7% |
| Immigrants | Sweden | 99.4 /100 | #70 | Exceptional 16.7% |
| Immigrants | Belgium | 99.3 /100 | #71 | Exceptional 16.7% |
| Germans | 99.3 /100 | #72 | Exceptional 16.7% |
| Burmese | 99.3 /100 | #73 | Exceptional 16.7% |
| Slavs | 99.3 /100 | #74 | Exceptional 16.7% |
| Estonians | 99.3 /100 | #75 | Exceptional 16.7% |
| Immigrants | Serbia | 99.3 /100 | #76 | Exceptional 16.7% |
| Immigrants | Hungary | 99.3 /100 | #77 | Exceptional 16.7% |
| Peruvians | 99.3 /100 | #78 | Exceptional 16.7% |
| Immigrants | Bulgaria | 99.3 /100 | #79 | Exceptional 16.7% |
| Egyptians | 99.2 /100 | #80 | Exceptional 16.7% |
| Immigrants | Netherlands | 99.2 /100 | #81 | Exceptional 16.7% |
| Swiss | 99.2 /100 | #82 | Exceptional 16.7% |
| Serbians | 99.1 /100 | #83 | Exceptional 16.7% |
Demographics Similar to Immigrants from Spain by Cognitive Disability
In terms of cognitive disability, the demographic groups most similar to Immigrants from Spain are Nonimmigrants (17.4%, a difference of 0.010%), Immigrants from Haiti (17.4%, a difference of 0.020%), Immigrants from Western Asia (17.4%, a difference of 0.060%), Immigrants from France (17.4%, a difference of 0.070%), and Delaware (17.4%, a difference of 0.070%).
| Demographics | Rating | Rank | Cognitive Disability |
| Spaniards | 40.3 /100 | #183 | Average 17.3% |
| Crow | 39.1 /100 | #184 | Fair 17.3% |
| Afghans | 38.2 /100 | #185 | Fair 17.3% |
| Cambodians | 35.9 /100 | #186 | Fair 17.3% |
| Immigrants | Fiji | 33.7 /100 | #187 | Fair 17.4% |
| Immigrants | France | 29.8 /100 | #188 | Fair 17.4% |
| Immigrants | Western Asia | 29.5 /100 | #189 | Fair 17.4% |
| Immigrants | Spain | 27.7 /100 | #190 | Fair 17.4% |
| Immigrants | Nonimmigrants | 27.4 /100 | #191 | Fair 17.4% |
| Immigrants | Haiti | 27.1 /100 | #192 | Fair 17.4% |
| Delaware | 25.6 /100 | #193 | Fair 17.4% |
| Immigrants | Bosnia and Herzegovina | 22.0 /100 | #194 | Fair 17.4% |
| New Zealanders | 21.1 /100 | #195 | Fair 17.4% |
| Guyanese | 17.5 /100 | #196 | Poor 17.5% |
| Immigrants | Afghanistan | 16.7 /100 | #197 | Poor 17.5% |