Jamaican vs Iranian Vision Disability
COMPARE
Jamaican
Iranian
Vision Disability
Vision Disability Comparison
Jamaicans
Iranians
2.4%
VISION DISABILITY
0.1/ 100
METRIC RATING
262nd/ 347
METRIC RANK
1.8%
VISION DISABILITY
100.0/ 100
METRIC RATING
8th/ 347
METRIC RANK
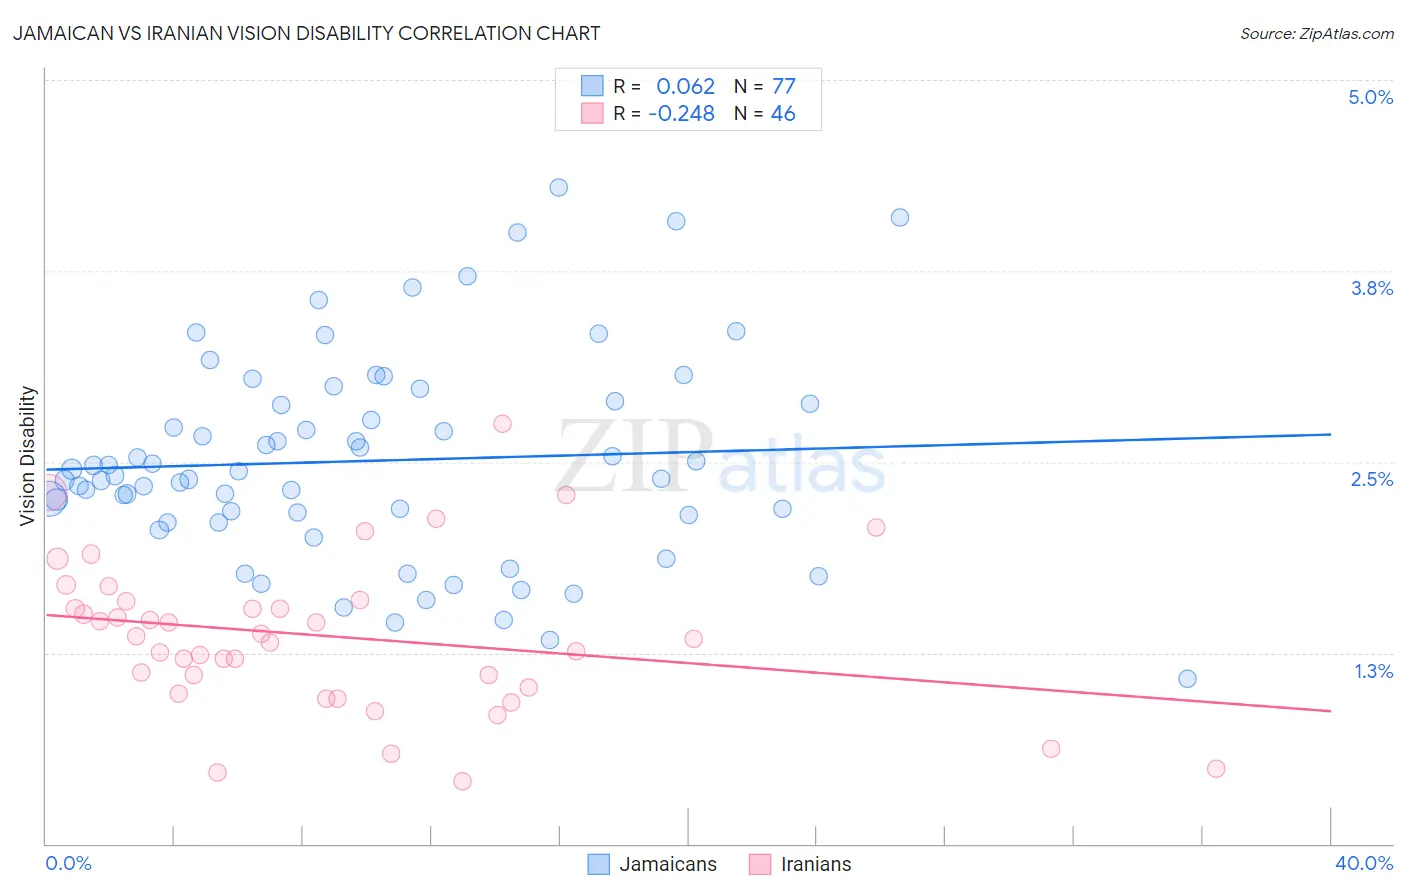
Jamaican vs Iranian Vision Disability Correlation Chart
The statistical analysis conducted on geographies consisting of 367,713,681 people shows a slight positive correlation between the proportion of Jamaicans and percentage of population with vision disability in the United States with a correlation coefficient (R) of 0.062 and weighted average of 2.4%. Similarly, the statistical analysis conducted on geographies consisting of 316,677,046 people shows a weak negative correlation between the proportion of Iranians and percentage of population with vision disability in the United States with a correlation coefficient (R) of -0.248 and weighted average of 1.8%, a difference of 33.6%.
Vision Disability Correlation Summary
| Measurement | Jamaican | Iranian |
| Minimum | 1.1% | 0.41% |
| Maximum | 4.3% | 2.8% |
| Range | 3.2% | 2.3% |
| Mean | 2.5% | 1.4% |
| Median | 2.4% | 1.4% |
| Interquartile 25% (IQ1) | 2.1% | 1.0% |
| Interquartile 75% (IQ3) | 2.9% | 1.6% |
| Interquartile Range (IQR) | 0.76% | 0.57% |
| Standard Deviation (Sample) | 0.67% | 0.51% |
| Standard Deviation (Population) | 0.67% | 0.50% |
Similar Demographics by Vision Disability
Demographics Similar to Jamaicans by Vision Disability
In terms of vision disability, the demographic groups most similar to Jamaicans are Fijian (2.4%, a difference of 0.030%), Belizean (2.4%, a difference of 0.24%), Immigrants from Belize (2.4%, a difference of 0.26%), Immigrants from Liberia (2.4%, a difference of 0.38%), and Immigrants from Jamaica (2.4%, a difference of 0.40%).
| Demographics | Rating | Rank | Vision Disability |
| Immigrants | Guatemala | 0.3 /100 | #255 | Tragic 2.4% |
| Immigrants | Haiti | 0.2 /100 | #256 | Tragic 2.4% |
| West Indians | 0.2 /100 | #257 | Tragic 2.4% |
| British West Indians | 0.2 /100 | #258 | Tragic 2.4% |
| Whites/Caucasians | 0.2 /100 | #259 | Tragic 2.4% |
| Belizeans | 0.2 /100 | #260 | Tragic 2.4% |
| Fijians | 0.1 /100 | #261 | Tragic 2.4% |
| Jamaicans | 0.1 /100 | #262 | Tragic 2.4% |
| Immigrants | Belize | 0.1 /100 | #263 | Tragic 2.4% |
| Immigrants | Liberia | 0.1 /100 | #264 | Tragic 2.4% |
| Immigrants | Jamaica | 0.1 /100 | #265 | Tragic 2.4% |
| Mexican American Indians | 0.1 /100 | #266 | Tragic 2.4% |
| Ute | 0.1 /100 | #267 | Tragic 2.4% |
| Senegalese | 0.1 /100 | #268 | Tragic 2.4% |
| Celtics | 0.1 /100 | #269 | Tragic 2.4% |
Demographics Similar to Iranians by Vision Disability
In terms of vision disability, the demographic groups most similar to Iranians are Immigrants from South Central Asia (1.8%, a difference of 0.15%), Immigrants from Iran (1.8%, a difference of 0.21%), Immigrants from Singapore (1.8%, a difference of 0.74%), Okinawan (1.8%, a difference of 0.80%), and Immigrants from Hong Kong (1.8%, a difference of 0.93%).
| Demographics | Rating | Rank | Vision Disability |
| Immigrants | India | 100.0 /100 | #1 | Exceptional 1.7% |
| Filipinos | 100.0 /100 | #2 | Exceptional 1.7% |
| Immigrants | Taiwan | 100.0 /100 | #3 | Exceptional 1.7% |
| Thais | 100.0 /100 | #4 | Exceptional 1.7% |
| Okinawans | 100.0 /100 | #5 | Exceptional 1.8% |
| Immigrants | Iran | 100.0 /100 | #6 | Exceptional 1.8% |
| Immigrants | South Central Asia | 100.0 /100 | #7 | Exceptional 1.8% |
| Iranians | 100.0 /100 | #8 | Exceptional 1.8% |
| Immigrants | Singapore | 100.0 /100 | #9 | Exceptional 1.8% |
| Immigrants | Hong Kong | 100.0 /100 | #10 | Exceptional 1.8% |
| Immigrants | Israel | 100.0 /100 | #11 | Exceptional 1.8% |
| Immigrants | Korea | 100.0 /100 | #12 | Exceptional 1.8% |
| Immigrants | Eastern Asia | 100.0 /100 | #13 | Exceptional 1.8% |
| Immigrants | China | 100.0 /100 | #14 | Exceptional 1.8% |
| Immigrants | Bolivia | 100.0 /100 | #15 | Exceptional 1.8% |