Jamaican vs Immigrants from Zimbabwe Vision Disability
COMPARE
Jamaican
Immigrants from Zimbabwe
Vision Disability
Vision Disability Comparison
Jamaicans
Immigrants from Zimbabwe
2.4%
VISION DISABILITY
0.1/ 100
METRIC RATING
262nd/ 347
METRIC RANK
2.1%
VISION DISABILITY
91.0/ 100
METRIC RATING
120th/ 347
METRIC RANK
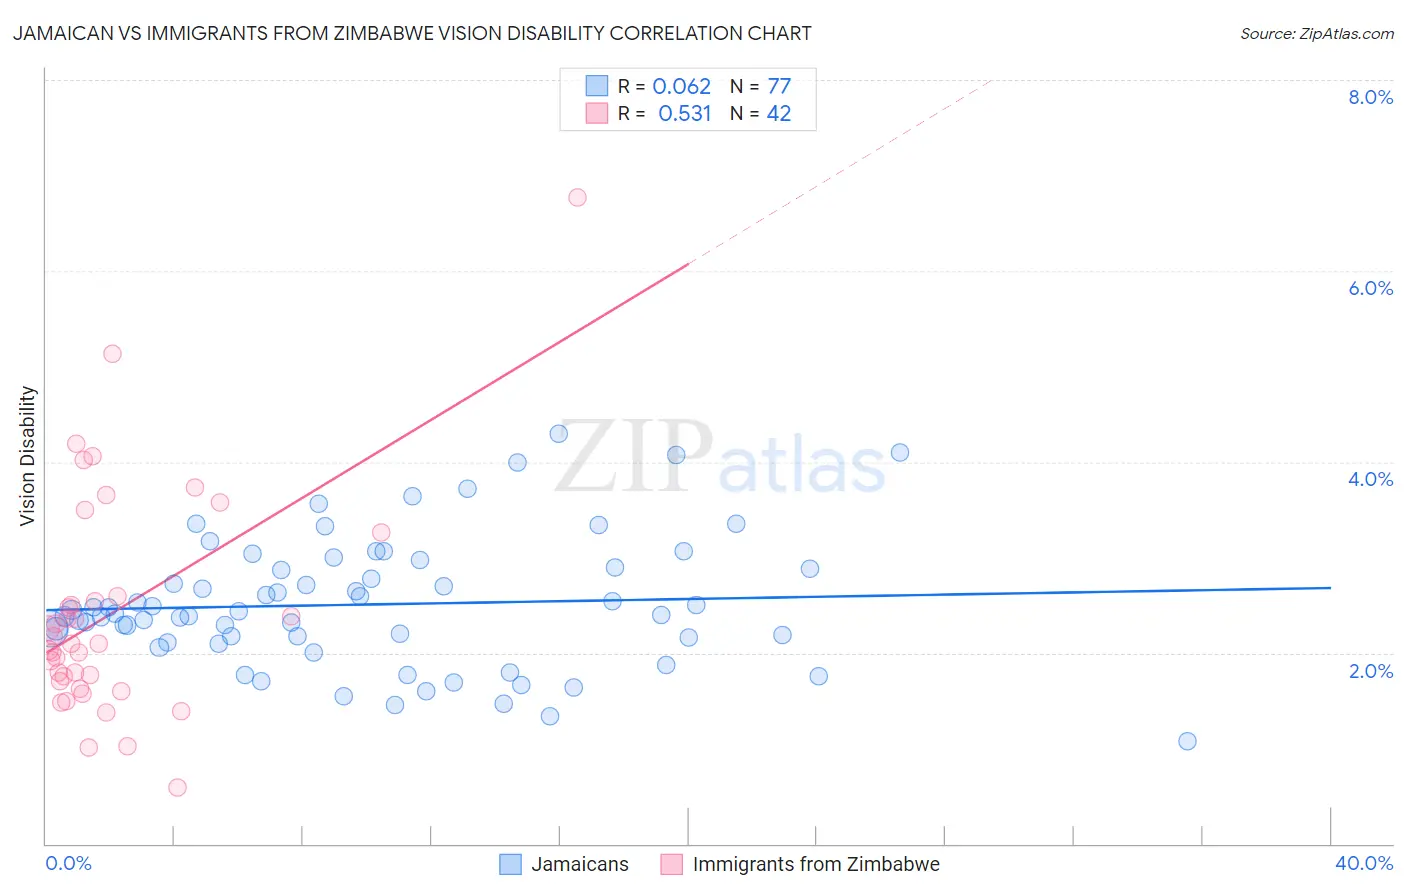
Jamaican vs Immigrants from Zimbabwe Vision Disability Correlation Chart
The statistical analysis conducted on geographies consisting of 367,713,681 people shows a slight positive correlation between the proportion of Jamaicans and percentage of population with vision disability in the United States with a correlation coefficient (R) of 0.062 and weighted average of 2.4%. Similarly, the statistical analysis conducted on geographies consisting of 117,800,208 people shows a substantial positive correlation between the proportion of Immigrants from Zimbabwe and percentage of population with vision disability in the United States with a correlation coefficient (R) of 0.531 and weighted average of 2.1%, a difference of 14.4%.
Vision Disability Correlation Summary
| Measurement | Jamaican | Immigrants from Zimbabwe |
| Minimum | 1.1% | 0.59% |
| Maximum | 4.3% | 6.8% |
| Range | 3.2% | 6.2% |
| Mean | 2.5% | 2.4% |
| Median | 2.4% | 2.1% |
| Interquartile 25% (IQ1) | 2.1% | 1.7% |
| Interquartile 75% (IQ3) | 2.9% | 2.6% |
| Interquartile Range (IQR) | 0.76% | 0.89% |
| Standard Deviation (Sample) | 0.67% | 1.2% |
| Standard Deviation (Population) | 0.67% | 1.2% |
Similar Demographics by Vision Disability
Demographics Similar to Jamaicans by Vision Disability
In terms of vision disability, the demographic groups most similar to Jamaicans are Fijian (2.4%, a difference of 0.030%), Belizean (2.4%, a difference of 0.24%), Immigrants from Belize (2.4%, a difference of 0.26%), Immigrants from Liberia (2.4%, a difference of 0.38%), and Immigrants from Jamaica (2.4%, a difference of 0.40%).
| Demographics | Rating | Rank | Vision Disability |
| Immigrants | Guatemala | 0.3 /100 | #255 | Tragic 2.4% |
| Immigrants | Haiti | 0.2 /100 | #256 | Tragic 2.4% |
| West Indians | 0.2 /100 | #257 | Tragic 2.4% |
| British West Indians | 0.2 /100 | #258 | Tragic 2.4% |
| Whites/Caucasians | 0.2 /100 | #259 | Tragic 2.4% |
| Belizeans | 0.2 /100 | #260 | Tragic 2.4% |
| Fijians | 0.1 /100 | #261 | Tragic 2.4% |
| Jamaicans | 0.1 /100 | #262 | Tragic 2.4% |
| Immigrants | Belize | 0.1 /100 | #263 | Tragic 2.4% |
| Immigrants | Liberia | 0.1 /100 | #264 | Tragic 2.4% |
| Immigrants | Jamaica | 0.1 /100 | #265 | Tragic 2.4% |
| Mexican American Indians | 0.1 /100 | #266 | Tragic 2.4% |
| Ute | 0.1 /100 | #267 | Tragic 2.4% |
| Senegalese | 0.1 /100 | #268 | Tragic 2.4% |
| Celtics | 0.1 /100 | #269 | Tragic 2.4% |
Demographics Similar to Immigrants from Zimbabwe by Vision Disability
In terms of vision disability, the demographic groups most similar to Immigrants from Zimbabwe are Immigrants from Uganda (2.1%, a difference of 0.060%), Immigrants from Philippines (2.1%, a difference of 0.070%), Immigrants from Scotland (2.1%, a difference of 0.12%), Immigrants from Ukraine (2.1%, a difference of 0.13%), and Immigrants from Albania (2.1%, a difference of 0.13%).
| Demographics | Rating | Rank | Vision Disability |
| Kenyans | 92.5 /100 | #113 | Exceptional 2.1% |
| Croatians | 92.3 /100 | #114 | Exceptional 2.1% |
| Immigrants | Vietnam | 92.2 /100 | #115 | Exceptional 2.1% |
| Ugandans | 92.2 /100 | #116 | Exceptional 2.1% |
| Poles | 92.0 /100 | #117 | Exceptional 2.1% |
| Immigrants | Philippines | 91.4 /100 | #118 | Exceptional 2.1% |
| Immigrants | Uganda | 91.4 /100 | #119 | Exceptional 2.1% |
| Immigrants | Zimbabwe | 91.0 /100 | #120 | Exceptional 2.1% |
| Immigrants | Scotland | 90.4 /100 | #121 | Exceptional 2.1% |
| Immigrants | Ukraine | 90.4 /100 | #122 | Exceptional 2.1% |
| Immigrants | Albania | 90.4 /100 | #123 | Exceptional 2.1% |
| Immigrants | Spain | 89.8 /100 | #124 | Excellent 2.1% |
| Immigrants | Venezuela | 89.8 /100 | #125 | Excellent 2.1% |
| Immigrants | Peru | 89.5 /100 | #126 | Excellent 2.1% |
| Sudanese | 89.2 /100 | #127 | Excellent 2.1% |