Immigrants from Sudan vs Honduran Cognitive Disability
COMPARE
Immigrants from Sudan
Honduran
Cognitive Disability
Cognitive Disability Comparison
Immigrants from Sudan
Hondurans
18.8%
COGNITIVE DISABILITY
0.0/ 100
METRIC RATING
332nd/ 347
METRIC RANK
18.0%
COGNITIVE DISABILITY
0.3/ 100
METRIC RATING
269th/ 347
METRIC RANK
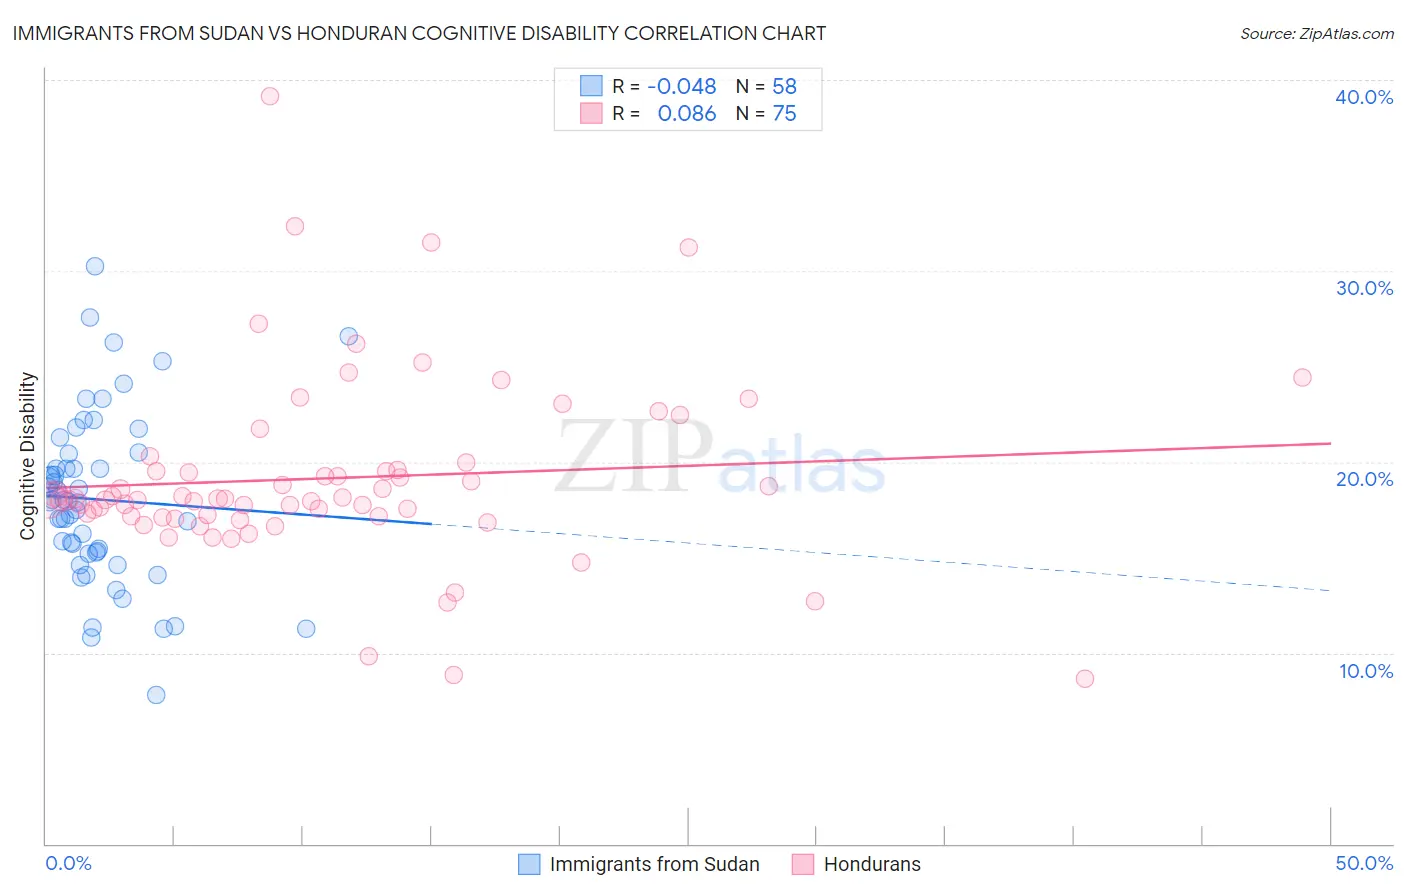
Immigrants from Sudan vs Honduran Cognitive Disability Correlation Chart
The statistical analysis conducted on geographies consisting of 118,956,545 people shows no correlation between the proportion of Immigrants from Sudan and percentage of population with cognitive disability in the United States with a correlation coefficient (R) of -0.048 and weighted average of 18.8%. Similarly, the statistical analysis conducted on geographies consisting of 357,766,918 people shows a slight positive correlation between the proportion of Hondurans and percentage of population with cognitive disability in the United States with a correlation coefficient (R) of 0.086 and weighted average of 18.0%, a difference of 4.4%.
Cognitive Disability Correlation Summary
| Measurement | Immigrants from Sudan | Honduran |
| Minimum | 7.8% | 8.7% |
| Maximum | 30.2% | 39.1% |
| Range | 22.4% | 30.5% |
| Mean | 18.0% | 19.1% |
| Median | 17.9% | 18.0% |
| Interquartile 25% (IQ1) | 15.3% | 17.1% |
| Interquartile 75% (IQ3) | 20.4% | 19.6% |
| Interquartile Range (IQR) | 5.1% | 2.5% |
| Standard Deviation (Sample) | 4.5% | 4.9% |
| Standard Deviation (Population) | 4.4% | 4.8% |
Similar Demographics by Cognitive Disability
Demographics Similar to Immigrants from Sudan by Cognitive Disability
In terms of cognitive disability, the demographic groups most similar to Immigrants from Sudan are Pima (18.8%, a difference of 0.020%), Immigrants from Yemen (18.8%, a difference of 0.060%), Immigrants from Dominican Republic (18.8%, a difference of 0.080%), Navajo (18.8%, a difference of 0.18%), and Kiowa (18.7%, a difference of 0.40%).
| Demographics | Rating | Rank | Cognitive Disability |
| Indonesians | 0.0 /100 | #325 | Tragic 18.7% |
| Immigrants | Senegal | 0.0 /100 | #326 | Tragic 18.7% |
| U.S. Virgin Islanders | 0.0 /100 | #327 | Tragic 18.7% |
| Kiowa | 0.0 /100 | #328 | Tragic 18.7% |
| Navajo | 0.0 /100 | #329 | Tragic 18.8% |
| Immigrants | Dominican Republic | 0.0 /100 | #330 | Tragic 18.8% |
| Pima | 0.0 /100 | #331 | Tragic 18.8% |
| Immigrants | Sudan | 0.0 /100 | #332 | Tragic 18.8% |
| Immigrants | Yemen | 0.0 /100 | #333 | Tragic 18.8% |
| Sudanese | 0.0 /100 | #334 | Tragic 18.9% |
| Senegalese | 0.0 /100 | #335 | Tragic 19.0% |
| Blacks/African Americans | 0.0 /100 | #336 | Tragic 19.0% |
| Immigrants | Saudi Arabia | 0.0 /100 | #337 | Tragic 19.1% |
| Lumbee | 0.0 /100 | #338 | Tragic 19.1% |
| Puerto Ricans | 0.0 /100 | #339 | Tragic 19.2% |
Demographics Similar to Hondurans by Cognitive Disability
In terms of cognitive disability, the demographic groups most similar to Hondurans are Immigrants from Bahamas (18.0%, a difference of 0.010%), Potawatomi (18.0%, a difference of 0.080%), Immigrants from Honduras (18.0%, a difference of 0.10%), Cherokee (18.0%, a difference of 0.14%), and Nepalese (18.0%, a difference of 0.15%).
| Demographics | Rating | Rank | Cognitive Disability |
| Sierra Leoneans | 0.4 /100 | #262 | Tragic 17.9% |
| Immigrants | Barbados | 0.4 /100 | #263 | Tragic 17.9% |
| Menominee | 0.4 /100 | #264 | Tragic 18.0% |
| Spanish Americans | 0.4 /100 | #265 | Tragic 18.0% |
| Belizeans | 0.4 /100 | #266 | Tragic 18.0% |
| Nepalese | 0.3 /100 | #267 | Tragic 18.0% |
| Cherokee | 0.3 /100 | #268 | Tragic 18.0% |
| Hondurans | 0.3 /100 | #269 | Tragic 18.0% |
| Immigrants | Bahamas | 0.3 /100 | #270 | Tragic 18.0% |
| Potawatomi | 0.2 /100 | #271 | Tragic 18.0% |
| Immigrants | Honduras | 0.2 /100 | #272 | Tragic 18.0% |
| Immigrants | Nepal | 0.2 /100 | #273 | Tragic 18.0% |
| Immigrants | Nigeria | 0.2 /100 | #274 | Tragic 18.0% |
| Immigrants | Laos | 0.2 /100 | #275 | Tragic 18.1% |
| Yuman | 0.2 /100 | #276 | Tragic 18.1% |