Assyrian/Chaldean/Syriac vs Honduran Cognitive Disability
COMPARE
Assyrian/Chaldean/Syriac
Honduran
Cognitive Disability
Cognitive Disability Comparison
Assyrians/Chaldeans/Syriacs
Hondurans
16.2%
COGNITIVE DISABILITY
100.0/ 100
METRIC RATING
9th/ 347
METRIC RANK
18.0%
COGNITIVE DISABILITY
0.3/ 100
METRIC RATING
269th/ 347
METRIC RANK
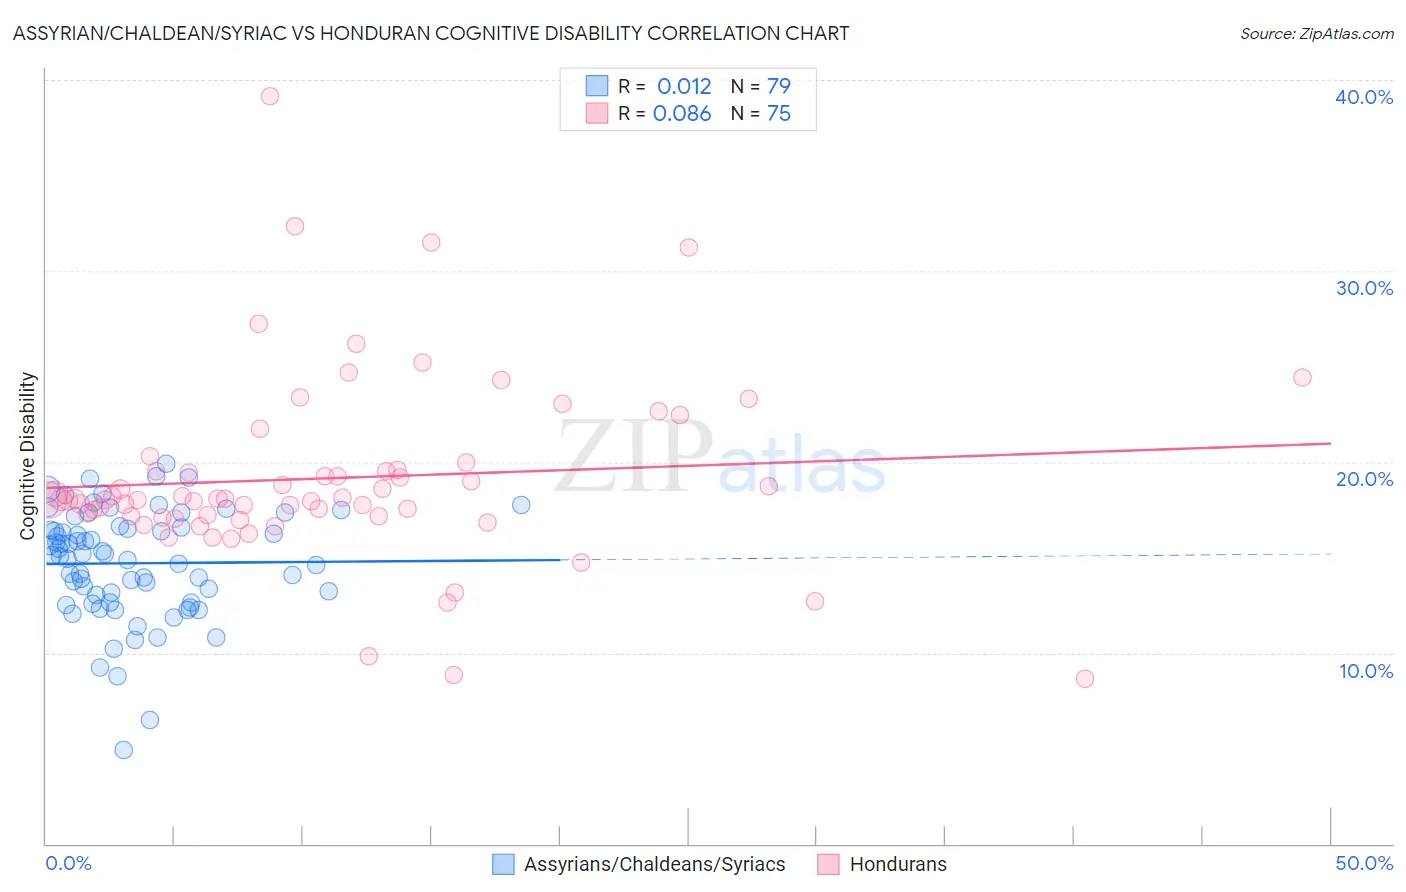
Assyrian/Chaldean/Syriac vs Honduran Cognitive Disability Correlation Chart
The statistical analysis conducted on geographies consisting of 110,310,504 people shows no correlation between the proportion of Assyrians/Chaldeans/Syriacs and percentage of population with cognitive disability in the United States with a correlation coefficient (R) of 0.012 and weighted average of 16.2%. Similarly, the statistical analysis conducted on geographies consisting of 357,766,918 people shows a slight positive correlation between the proportion of Hondurans and percentage of population with cognitive disability in the United States with a correlation coefficient (R) of 0.086 and weighted average of 18.0%, a difference of 11.2%.
Cognitive Disability Correlation Summary
| Measurement | Assyrian/Chaldean/Syriac | Honduran |
| Minimum | 4.9% | 8.7% |
| Maximum | 19.9% | 39.1% |
| Range | 15.0% | 30.5% |
| Mean | 14.7% | 19.1% |
| Median | 15.1% | 18.0% |
| Interquartile 25% (IQ1) | 12.7% | 17.1% |
| Interquartile 75% (IQ3) | 16.6% | 19.6% |
| Interquartile Range (IQR) | 3.9% | 2.5% |
| Standard Deviation (Sample) | 2.9% | 4.9% |
| Standard Deviation (Population) | 2.8% | 4.8% |
Similar Demographics by Cognitive Disability
Demographics Similar to Assyrians/Chaldeans/Syriacs by Cognitive Disability
In terms of cognitive disability, the demographic groups most similar to Assyrians/Chaldeans/Syriacs are Immigrants from Scotland (16.2%, a difference of 0.040%), Immigrants from Czechoslovakia (16.2%, a difference of 0.13%), Maltese (16.2%, a difference of 0.29%), Immigrants from Poland (16.1%, a difference of 0.32%), and Immigrants from Ireland (16.1%, a difference of 0.34%).
| Demographics | Rating | Rank | Cognitive Disability |
| Immigrants | India | 100.0 /100 | #2 | Exceptional 15.9% |
| Chinese | 100.0 /100 | #3 | Exceptional 15.9% |
| Immigrants | Lithuania | 100.0 /100 | #4 | Exceptional 16.0% |
| Immigrants | Hong Kong | 100.0 /100 | #5 | Exceptional 16.0% |
| Thais | 100.0 /100 | #6 | Exceptional 16.1% |
| Immigrants | Ireland | 100.0 /100 | #7 | Exceptional 16.1% |
| Immigrants | Poland | 100.0 /100 | #8 | Exceptional 16.1% |
| Assyrians/Chaldeans/Syriacs | 100.0 /100 | #9 | Exceptional 16.2% |
| Immigrants | Scotland | 100.0 /100 | #10 | Exceptional 16.2% |
| Immigrants | Czechoslovakia | 100.0 /100 | #11 | Exceptional 16.2% |
| Maltese | 100.0 /100 | #12 | Exceptional 16.2% |
| Lithuanians | 100.0 /100 | #13 | Exceptional 16.3% |
| Immigrants | Austria | 100.0 /100 | #14 | Exceptional 16.3% |
| Immigrants | Greece | 100.0 /100 | #15 | Exceptional 16.3% |
| Eastern Europeans | 100.0 /100 | #16 | Exceptional 16.3% |
Demographics Similar to Hondurans by Cognitive Disability
In terms of cognitive disability, the demographic groups most similar to Hondurans are Immigrants from Bahamas (18.0%, a difference of 0.010%), Potawatomi (18.0%, a difference of 0.080%), Immigrants from Honduras (18.0%, a difference of 0.10%), Cherokee (18.0%, a difference of 0.14%), and Nepalese (18.0%, a difference of 0.15%).
| Demographics | Rating | Rank | Cognitive Disability |
| Sierra Leoneans | 0.4 /100 | #262 | Tragic 17.9% |
| Immigrants | Barbados | 0.4 /100 | #263 | Tragic 17.9% |
| Menominee | 0.4 /100 | #264 | Tragic 18.0% |
| Spanish Americans | 0.4 /100 | #265 | Tragic 18.0% |
| Belizeans | 0.4 /100 | #266 | Tragic 18.0% |
| Nepalese | 0.3 /100 | #267 | Tragic 18.0% |
| Cherokee | 0.3 /100 | #268 | Tragic 18.0% |
| Hondurans | 0.3 /100 | #269 | Tragic 18.0% |
| Immigrants | Bahamas | 0.3 /100 | #270 | Tragic 18.0% |
| Potawatomi | 0.2 /100 | #271 | Tragic 18.0% |
| Immigrants | Honduras | 0.2 /100 | #272 | Tragic 18.0% |
| Immigrants | Nepal | 0.2 /100 | #273 | Tragic 18.0% |
| Immigrants | Nigeria | 0.2 /100 | #274 | Tragic 18.0% |
| Immigrants | Laos | 0.2 /100 | #275 | Tragic 18.1% |
| Yuman | 0.2 /100 | #276 | Tragic 18.1% |