Israeli vs Honduran Unemployment Among Women with Children Ages 6 to 17 years
COMPARE
Israeli
Honduran
Unemployment Among Women with Children Ages 6 to 17 years
Unemployment Among Women with Children Ages 6 to 17 years Comparison
Israelis
Hondurans
8.7%
UNEMPLOYMENT AMONG WOMEN WITH CHILDREN AGES 6 TO 17 YEARS
95.9/ 100
METRIC RATING
120th/ 347
METRIC RANK
10.0%
UNEMPLOYMENT AMONG WOMEN WITH CHILDREN AGES 6 TO 17 YEARS
0.0/ 100
METRIC RATING
289th/ 347
METRIC RANK
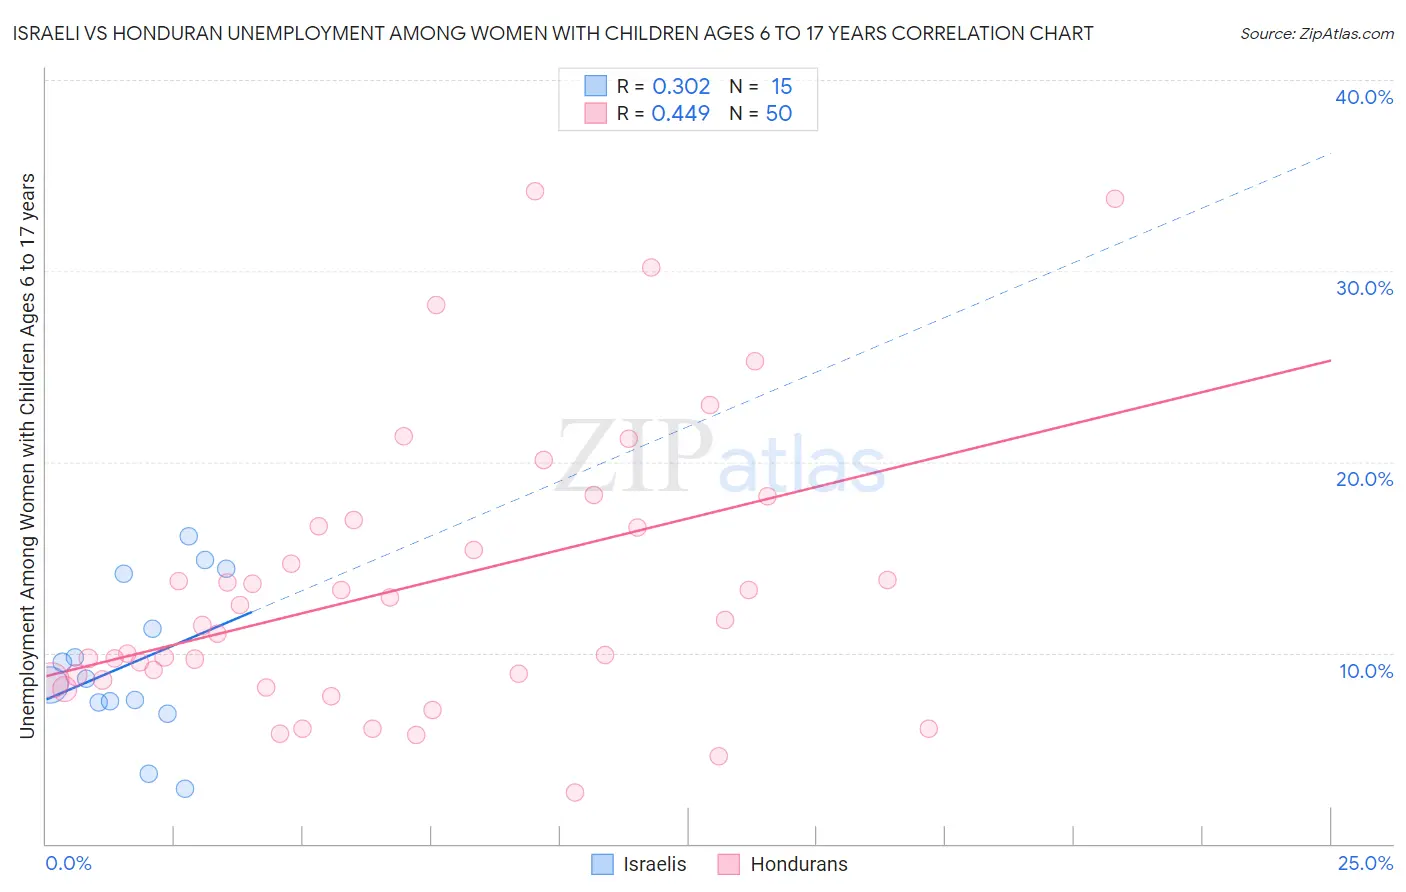
Israeli vs Honduran Unemployment Among Women with Children Ages 6 to 17 years Correlation Chart
The statistical analysis conducted on geographies consisting of 167,871,710 people shows a mild positive correlation between the proportion of Israelis and unemployment rate among women with children between the ages 6 and 17 in the United States with a correlation coefficient (R) of 0.302 and weighted average of 8.7%. Similarly, the statistical analysis conducted on geographies consisting of 273,347,918 people shows a moderate positive correlation between the proportion of Hondurans and unemployment rate among women with children between the ages 6 and 17 in the United States with a correlation coefficient (R) of 0.449 and weighted average of 10.0%, a difference of 15.6%.
Unemployment Among Women with Children Ages 6 to 17 years Correlation Summary
| Measurement | Israeli | Honduran |
| Minimum | 2.8% | 2.7% |
| Maximum | 16.1% | 34.2% |
| Range | 13.3% | 31.5% |
| Mean | 9.5% | 13.5% |
| Median | 8.7% | 11.6% |
| Interquartile 25% (IQ1) | 7.4% | 8.6% |
| Interquartile 75% (IQ3) | 14.2% | 16.6% |
| Interquartile Range (IQR) | 6.8% | 8.0% |
| Standard Deviation (Sample) | 4.0% | 7.4% |
| Standard Deviation (Population) | 3.8% | 7.3% |
Similar Demographics by Unemployment Among Women with Children Ages 6 to 17 years
Demographics Similar to Israelis by Unemployment Among Women with Children Ages 6 to 17 years
In terms of unemployment among women with children ages 6 to 17 years, the demographic groups most similar to Israelis are Immigrants from Grenada (8.6%, a difference of 0.080%), Pueblo (8.6%, a difference of 0.090%), Immigrants from Denmark (8.7%, a difference of 0.11%), Albanian (8.6%, a difference of 0.12%), and Zimbabwean (8.6%, a difference of 0.13%).
| Demographics | Rating | Rank | Unemployment Among Women with Children Ages 6 to 17 years |
| Eastern Europeans | 96.8 /100 | #113 | Exceptional 8.6% |
| Immigrants | Russia | 96.7 /100 | #114 | Exceptional 8.6% |
| Argentineans | 96.5 /100 | #115 | Exceptional 8.6% |
| Zimbabweans | 96.3 /100 | #116 | Exceptional 8.6% |
| Albanians | 96.3 /100 | #117 | Exceptional 8.6% |
| Pueblo | 96.2 /100 | #118 | Exceptional 8.6% |
| Immigrants | Grenada | 96.2 /100 | #119 | Exceptional 8.6% |
| Israelis | 95.9 /100 | #120 | Exceptional 8.7% |
| Immigrants | Denmark | 95.5 /100 | #121 | Exceptional 8.7% |
| Immigrants | Egypt | 95.0 /100 | #122 | Exceptional 8.7% |
| Immigrants | Morocco | 94.9 /100 | #123 | Exceptional 8.7% |
| Immigrants | Lebanon | 94.9 /100 | #124 | Exceptional 8.7% |
| South Africans | 94.6 /100 | #125 | Exceptional 8.7% |
| Immigrants | Northern Africa | 94.4 /100 | #126 | Exceptional 8.7% |
| Czechs | 94.4 /100 | #127 | Exceptional 8.7% |
Demographics Similar to Hondurans by Unemployment Among Women with Children Ages 6 to 17 years
In terms of unemployment among women with children ages 6 to 17 years, the demographic groups most similar to Hondurans are Subsaharan African (10.0%, a difference of 0.010%), Nonimmigrants (10.0%, a difference of 0.040%), Carpatho Rusyn (10.0%, a difference of 0.050%), Haitian (10.0%, a difference of 0.14%), and Ecuadorian (10.0%, a difference of 0.23%).
| Demographics | Rating | Rank | Unemployment Among Women with Children Ages 6 to 17 years |
| Slovaks | 0.0 /100 | #282 | Tragic 9.8% |
| Central American Indians | 0.0 /100 | #283 | Tragic 9.9% |
| Yakama | 0.0 /100 | #284 | Tragic 9.9% |
| Hispanics or Latinos | 0.0 /100 | #285 | Tragic 9.9% |
| Choctaw | 0.0 /100 | #286 | Tragic 9.9% |
| Sierra Leoneans | 0.0 /100 | #287 | Tragic 9.9% |
| Shoshone | 0.0 /100 | #288 | Tragic 10.0% |
| Hondurans | 0.0 /100 | #289 | Tragic 10.0% |
| Sub-Saharan Africans | 0.0 /100 | #290 | Tragic 10.0% |
| Immigrants | Nonimmigrants | 0.0 /100 | #291 | Tragic 10.0% |
| Carpatho Rusyns | 0.0 /100 | #292 | Tragic 10.0% |
| Haitians | 0.0 /100 | #293 | Tragic 10.0% |
| Ecuadorians | 0.0 /100 | #294 | Tragic 10.0% |
| Cherokee | 0.0 /100 | #295 | Tragic 10.0% |
| Immigrants | Western Africa | 0.0 /100 | #296 | Tragic 10.1% |