Iroquois vs Osage Disability Age Under 5
COMPARE
Iroquois
Osage
Disability Age Under 5
Disability Age Under 5 Comparison
Iroquois
Osage
1.5%
DISABILITY AGE UNDER 5
0.0/ 100
METRIC RATING
274th/ 347
METRIC RANK
1.8%
DISABILITY AGE UNDER 5
0.0/ 100
METRIC RATING
327th/ 347
METRIC RANK
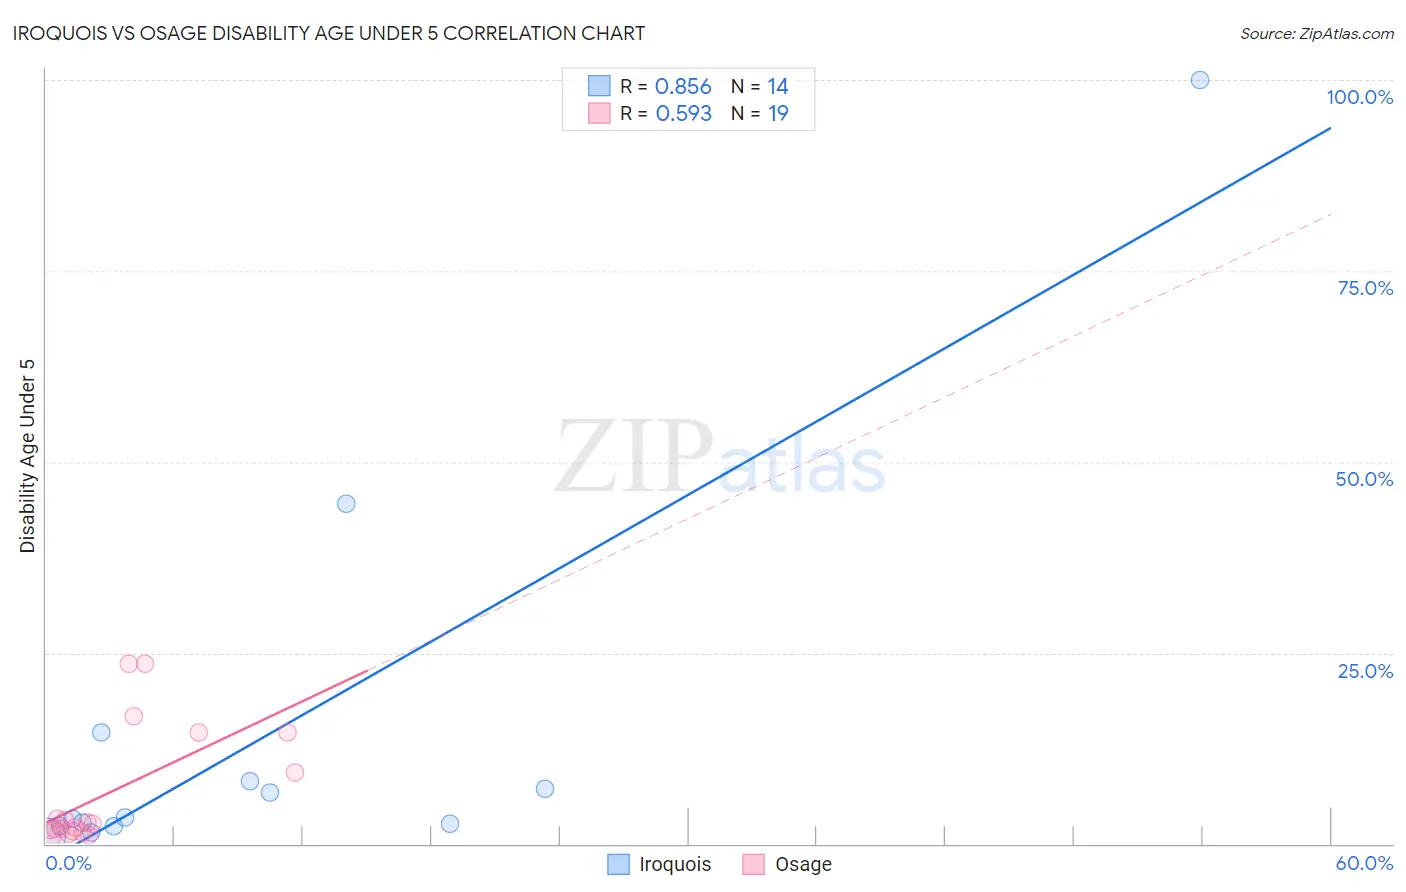
Iroquois vs Osage Disability Age Under 5 Correlation Chart
The statistical analysis conducted on geographies consisting of 134,535,381 people shows a very strong positive correlation between the proportion of Iroquois and percentage of population with a disability under the age of 5 in the United States with a correlation coefficient (R) of 0.856 and weighted average of 1.5%. Similarly, the statistical analysis conducted on geographies consisting of 73,230,866 people shows a substantial positive correlation between the proportion of Osage and percentage of population with a disability under the age of 5 in the United States with a correlation coefficient (R) of 0.593 and weighted average of 1.8%, a difference of 25.6%.
Disability Age Under 5 Correlation Summary
| Measurement | Iroquois | Osage |
| Minimum | 1.0% | 0.80% |
| Maximum | 100.0% | 23.5% |
| Range | 99.0% | 22.7% |
| Mean | 14.3% | 6.7% |
| Median | 3.3% | 2.6% |
| Interquartile 25% (IQ1) | 2.2% | 1.7% |
| Interquartile 75% (IQ3) | 8.2% | 14.5% |
| Interquartile Range (IQR) | 5.9% | 12.8% |
| Standard Deviation (Sample) | 27.1% | 7.8% |
| Standard Deviation (Population) | 26.1% | 7.6% |
Similar Demographics by Disability Age Under 5
Demographics Similar to Iroquois by Disability Age Under 5
In terms of disability age under 5, the demographic groups most similar to Iroquois are Brazilian (1.5%, a difference of 0.11%), Alaskan Athabascan (1.5%, a difference of 0.27%), Black/African American (1.4%, a difference of 0.56%), Greek (1.5%, a difference of 0.69%), and Immigrants from Canada (1.4%, a difference of 0.72%).
| Demographics | Rating | Rank | Disability Age Under 5 |
| Cree | 0.1 /100 | #267 | Tragic 1.4% |
| Belgians | 0.1 /100 | #268 | Tragic 1.4% |
| Austrians | 0.1 /100 | #269 | Tragic 1.4% |
| Immigrants | North America | 0.1 /100 | #270 | Tragic 1.4% |
| Immigrants | Canada | 0.1 /100 | #271 | Tragic 1.4% |
| Blacks/African Americans | 0.1 /100 | #272 | Tragic 1.4% |
| Alaskan Athabascans | 0.1 /100 | #273 | Tragic 1.5% |
| Iroquois | 0.0 /100 | #274 | Tragic 1.5% |
| Brazilians | 0.0 /100 | #275 | Tragic 1.5% |
| Greeks | 0.0 /100 | #276 | Tragic 1.5% |
| Canadians | 0.0 /100 | #277 | Tragic 1.5% |
| Kiowa | 0.0 /100 | #278 | Tragic 1.5% |
| Danes | 0.0 /100 | #279 | Tragic 1.5% |
| British | 0.0 /100 | #280 | Tragic 1.5% |
| Czechoslovakians | 0.0 /100 | #281 | Tragic 1.5% |
Demographics Similar to Osage by Disability Age Under 5
In terms of disability age under 5, the demographic groups most similar to Osage are Sioux (1.8%, a difference of 0.39%), American (1.9%, a difference of 1.7%), Immigrants from Portugal (1.8%, a difference of 1.8%), Houma (1.9%, a difference of 2.2%), and Choctaw (1.9%, a difference of 2.5%).
| Demographics | Rating | Rank | Disability Age Under 5 |
| Scotch-Irish | 0.0 /100 | #320 | Tragic 1.7% |
| Ottawa | 0.0 /100 | #321 | Tragic 1.7% |
| Germans | 0.0 /100 | #322 | Tragic 1.7% |
| Chickasaw | 0.0 /100 | #323 | Tragic 1.7% |
| Cherokee | 0.0 /100 | #324 | Tragic 1.8% |
| Immigrants | Portugal | 0.0 /100 | #325 | Tragic 1.8% |
| Sioux | 0.0 /100 | #326 | Tragic 1.8% |
| Osage | 0.0 /100 | #327 | Tragic 1.8% |
| Americans | 0.0 /100 | #328 | Tragic 1.9% |
| Houma | 0.0 /100 | #329 | Tragic 1.9% |
| Choctaw | 0.0 /100 | #330 | Tragic 1.9% |
| French Canadians | 0.0 /100 | #331 | Tragic 1.9% |
| Chippewa | 0.0 /100 | #332 | Tragic 1.9% |
| Dutch West Indians | 0.0 /100 | #333 | Tragic 1.9% |
| Natives/Alaskans | 0.0 /100 | #334 | Tragic 1.9% |