Iroquois vs Immigrants from Dominican Republic Disability Age Under 5
COMPARE
Iroquois
Immigrants from Dominican Republic
Disability Age Under 5
Disability Age Under 5 Comparison
Iroquois
Immigrants from Dominican Republic
1.5%
DISABILITY AGE UNDER 5
0.0/ 100
METRIC RATING
274th/ 347
METRIC RANK
1.1%
DISABILITY AGE UNDER 5
97.5/ 100
METRIC RATING
88th/ 347
METRIC RANK
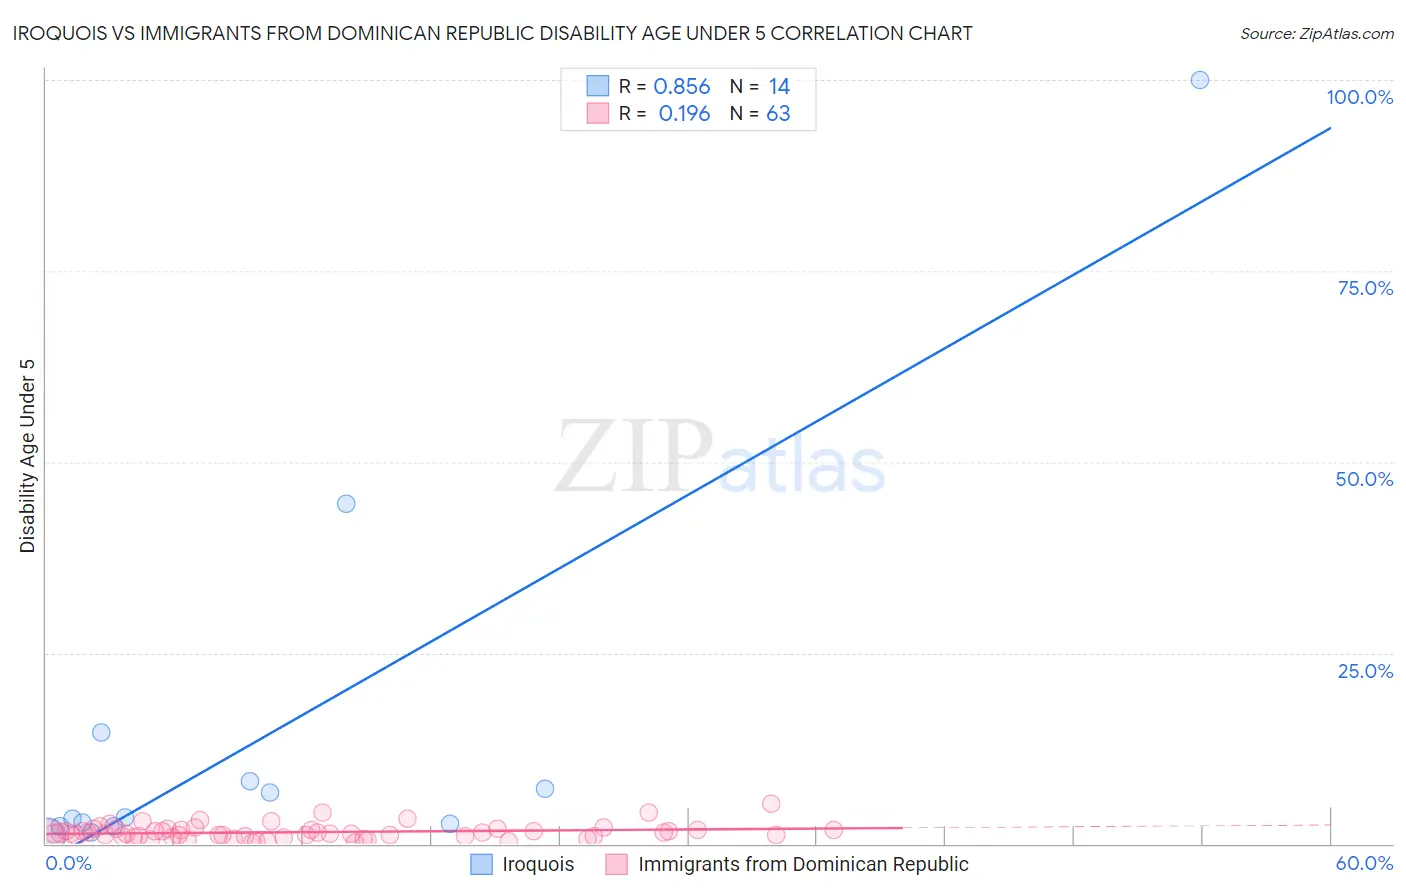
Iroquois vs Immigrants from Dominican Republic Disability Age Under 5 Correlation Chart
The statistical analysis conducted on geographies consisting of 134,535,381 people shows a very strong positive correlation between the proportion of Iroquois and percentage of population with a disability under the age of 5 in the United States with a correlation coefficient (R) of 0.856 and weighted average of 1.5%. Similarly, the statistical analysis conducted on geographies consisting of 160,628,361 people shows a poor positive correlation between the proportion of Immigrants from Dominican Republic and percentage of population with a disability under the age of 5 in the United States with a correlation coefficient (R) of 0.196 and weighted average of 1.1%, a difference of 27.9%.
Disability Age Under 5 Correlation Summary
| Measurement | Iroquois | Immigrants from Dominican Republic |
| Minimum | 1.0% | 0.15% |
| Maximum | 100.0% | 5.2% |
| Range | 99.0% | 5.1% |
| Mean | 14.3% | 1.5% |
| Median | 3.3% | 1.4% |
| Interquartile 25% (IQ1) | 2.2% | 0.99% |
| Interquartile 75% (IQ3) | 8.2% | 1.8% |
| Interquartile Range (IQR) | 5.9% | 0.82% |
| Standard Deviation (Sample) | 27.1% | 0.97% |
| Standard Deviation (Population) | 26.1% | 0.97% |
Similar Demographics by Disability Age Under 5
Demographics Similar to Iroquois by Disability Age Under 5
In terms of disability age under 5, the demographic groups most similar to Iroquois are Brazilian (1.5%, a difference of 0.11%), Alaskan Athabascan (1.5%, a difference of 0.27%), Black/African American (1.4%, a difference of 0.56%), Greek (1.5%, a difference of 0.69%), and Immigrants from Canada (1.4%, a difference of 0.72%).
| Demographics | Rating | Rank | Disability Age Under 5 |
| Cree | 0.1 /100 | #267 | Tragic 1.4% |
| Belgians | 0.1 /100 | #268 | Tragic 1.4% |
| Austrians | 0.1 /100 | #269 | Tragic 1.4% |
| Immigrants | North America | 0.1 /100 | #270 | Tragic 1.4% |
| Immigrants | Canada | 0.1 /100 | #271 | Tragic 1.4% |
| Blacks/African Americans | 0.1 /100 | #272 | Tragic 1.4% |
| Alaskan Athabascans | 0.1 /100 | #273 | Tragic 1.5% |
| Iroquois | 0.0 /100 | #274 | Tragic 1.5% |
| Brazilians | 0.0 /100 | #275 | Tragic 1.5% |
| Greeks | 0.0 /100 | #276 | Tragic 1.5% |
| Canadians | 0.0 /100 | #277 | Tragic 1.5% |
| Kiowa | 0.0 /100 | #278 | Tragic 1.5% |
| Danes | 0.0 /100 | #279 | Tragic 1.5% |
| British | 0.0 /100 | #280 | Tragic 1.5% |
| Czechoslovakians | 0.0 /100 | #281 | Tragic 1.5% |
Demographics Similar to Immigrants from Dominican Republic by Disability Age Under 5
In terms of disability age under 5, the demographic groups most similar to Immigrants from Dominican Republic are Ugandan (1.1%, a difference of 0.020%), Okinawan (1.1%, a difference of 0.040%), Sudanese (1.1%, a difference of 0.17%), Immigrants from Zaire (1.1%, a difference of 0.25%), and Ethiopian (1.1%, a difference of 0.28%).
| Demographics | Rating | Rank | Disability Age Under 5 |
| Turks | 98.0 /100 | #81 | Exceptional 1.1% |
| Immigrants | Jordan | 97.9 /100 | #82 | Exceptional 1.1% |
| Immigrants | Syria | 97.9 /100 | #83 | Exceptional 1.1% |
| Immigrants | Zaire | 97.8 /100 | #84 | Exceptional 1.1% |
| Sudanese | 97.7 /100 | #85 | Exceptional 1.1% |
| Okinawans | 97.6 /100 | #86 | Exceptional 1.1% |
| Ugandans | 97.5 /100 | #87 | Exceptional 1.1% |
| Immigrants | Dominican Republic | 97.5 /100 | #88 | Exceptional 1.1% |
| Ethiopians | 97.2 /100 | #89 | Exceptional 1.1% |
| Chinese | 97.2 /100 | #90 | Exceptional 1.1% |
| Albanians | 97.2 /100 | #91 | Exceptional 1.1% |
| Immigrants | Cuba | 97.0 /100 | #92 | Exceptional 1.1% |
| Spanish Americans | 96.9 /100 | #93 | Exceptional 1.1% |
| Sri Lankans | 96.8 /100 | #94 | Exceptional 1.1% |
| Immigrants | Moldova | 96.8 /100 | #95 | Exceptional 1.1% |