Immigrants from Lebanon vs Immigrants from Dominican Republic Disability Age Under 5
COMPARE
Immigrants from Lebanon
Immigrants from Dominican Republic
Disability Age Under 5
Disability Age Under 5 Comparison
Immigrants from Lebanon
Immigrants from Dominican Republic
1.2%
DISABILITY AGE UNDER 5
95.0/ 100
METRIC RATING
110th/ 347
METRIC RANK
1.1%
DISABILITY AGE UNDER 5
97.5/ 100
METRIC RATING
88th/ 347
METRIC RANK
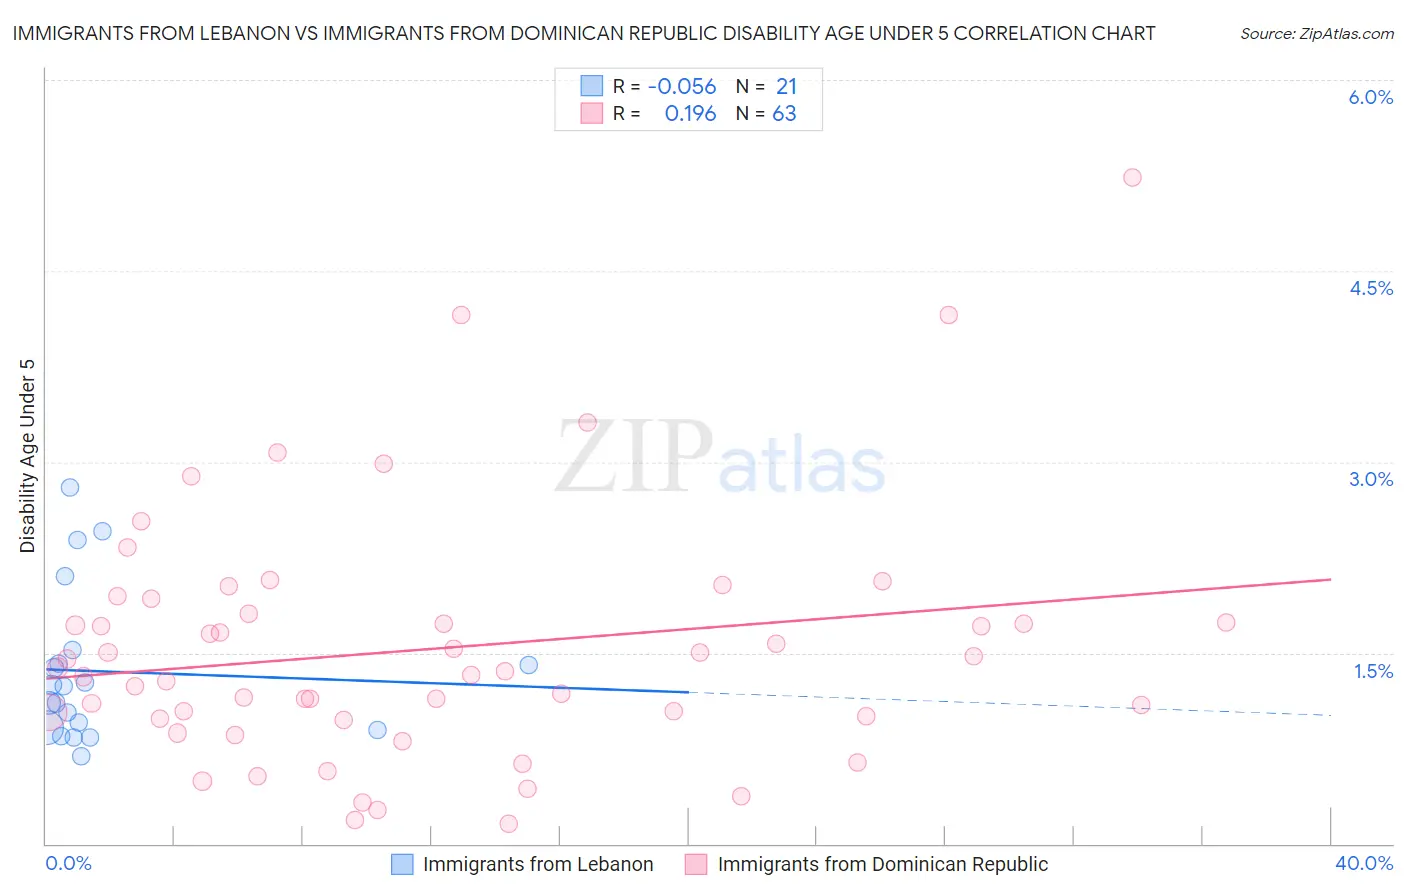
Immigrants from Lebanon vs Immigrants from Dominican Republic Disability Age Under 5 Correlation Chart
The statistical analysis conducted on geographies consisting of 139,551,916 people shows a slight negative correlation between the proportion of Immigrants from Lebanon and percentage of population with a disability under the age of 5 in the United States with a correlation coefficient (R) of -0.056 and weighted average of 1.2%. Similarly, the statistical analysis conducted on geographies consisting of 160,628,361 people shows a poor positive correlation between the proportion of Immigrants from Dominican Republic and percentage of population with a disability under the age of 5 in the United States with a correlation coefficient (R) of 0.196 and weighted average of 1.1%, a difference of 1.8%.
Disability Age Under 5 Correlation Summary
| Measurement | Immigrants from Lebanon | Immigrants from Dominican Republic |
| Minimum | 0.69% | 0.15% |
| Maximum | 2.8% | 5.2% |
| Range | 2.1% | 5.1% |
| Mean | 1.4% | 1.5% |
| Median | 1.2% | 1.4% |
| Interquartile 25% (IQ1) | 0.90% | 0.99% |
| Interquartile 75% (IQ3) | 1.5% | 1.8% |
| Interquartile Range (IQR) | 0.57% | 0.82% |
| Standard Deviation (Sample) | 0.59% | 0.97% |
| Standard Deviation (Population) | 0.58% | 0.97% |
Similar Demographics by Disability Age Under 5
Demographics Similar to Immigrants from Lebanon by Disability Age Under 5
In terms of disability age under 5, the demographic groups most similar to Immigrants from Lebanon are Immigrants from Panama (1.2%, a difference of 0.020%), Iraqi (1.2%, a difference of 0.040%), Immigrants from West Indies (1.2%, a difference of 0.17%), Senegalese (1.2%, a difference of 0.20%), and Cambodian (1.2%, a difference of 0.21%).
| Demographics | Rating | Rank | Disability Age Under 5 |
| Immigrants | Nicaragua | 96.0 /100 | #103 | Exceptional 1.2% |
| Indonesians | 95.9 /100 | #104 | Exceptional 1.2% |
| Immigrants | South Africa | 95.6 /100 | #105 | Exceptional 1.2% |
| Cambodians | 95.4 /100 | #106 | Exceptional 1.2% |
| Immigrants | West Indies | 95.3 /100 | #107 | Exceptional 1.2% |
| Iraqis | 95.1 /100 | #108 | Exceptional 1.2% |
| Immigrants | Panama | 95.0 /100 | #109 | Exceptional 1.2% |
| Immigrants | Lebanon | 95.0 /100 | #110 | Exceptional 1.2% |
| Senegalese | 94.6 /100 | #111 | Exceptional 1.2% |
| Immigrants | Australia | 94.4 /100 | #112 | Exceptional 1.2% |
| Immigrants | Oceania | 94.2 /100 | #113 | Exceptional 1.2% |
| Belizeans | 93.9 /100 | #114 | Exceptional 1.2% |
| Immigrants | Caribbean | 93.8 /100 | #115 | Exceptional 1.2% |
| Immigrants | Northern Africa | 93.8 /100 | #116 | Exceptional 1.2% |
| Immigrants | Philippines | 93.5 /100 | #117 | Exceptional 1.2% |
Demographics Similar to Immigrants from Dominican Republic by Disability Age Under 5
In terms of disability age under 5, the demographic groups most similar to Immigrants from Dominican Republic are Ugandan (1.1%, a difference of 0.020%), Okinawan (1.1%, a difference of 0.040%), Sudanese (1.1%, a difference of 0.17%), Immigrants from Zaire (1.1%, a difference of 0.25%), and Ethiopian (1.1%, a difference of 0.28%).
| Demographics | Rating | Rank | Disability Age Under 5 |
| Turks | 98.0 /100 | #81 | Exceptional 1.1% |
| Immigrants | Jordan | 97.9 /100 | #82 | Exceptional 1.1% |
| Immigrants | Syria | 97.9 /100 | #83 | Exceptional 1.1% |
| Immigrants | Zaire | 97.8 /100 | #84 | Exceptional 1.1% |
| Sudanese | 97.7 /100 | #85 | Exceptional 1.1% |
| Okinawans | 97.6 /100 | #86 | Exceptional 1.1% |
| Ugandans | 97.5 /100 | #87 | Exceptional 1.1% |
| Immigrants | Dominican Republic | 97.5 /100 | #88 | Exceptional 1.1% |
| Ethiopians | 97.2 /100 | #89 | Exceptional 1.1% |
| Chinese | 97.2 /100 | #90 | Exceptional 1.1% |
| Albanians | 97.2 /100 | #91 | Exceptional 1.1% |
| Immigrants | Cuba | 97.0 /100 | #92 | Exceptional 1.1% |
| Spanish Americans | 96.9 /100 | #93 | Exceptional 1.1% |
| Sri Lankans | 96.8 /100 | #94 | Exceptional 1.1% |
| Immigrants | Moldova | 96.8 /100 | #95 | Exceptional 1.1% |