Serbian vs Afghan Hearing Disability
COMPARE
Serbian
Afghan
Hearing Disability
Hearing Disability Comparison
Serbians
Afghans
3.3%
HEARING DISABILITY
2.2/ 100
METRIC RATING
236th/ 347
METRIC RANK
2.7%
HEARING DISABILITY
97.6/ 100
METRIC RATING
72nd/ 347
METRIC RANK
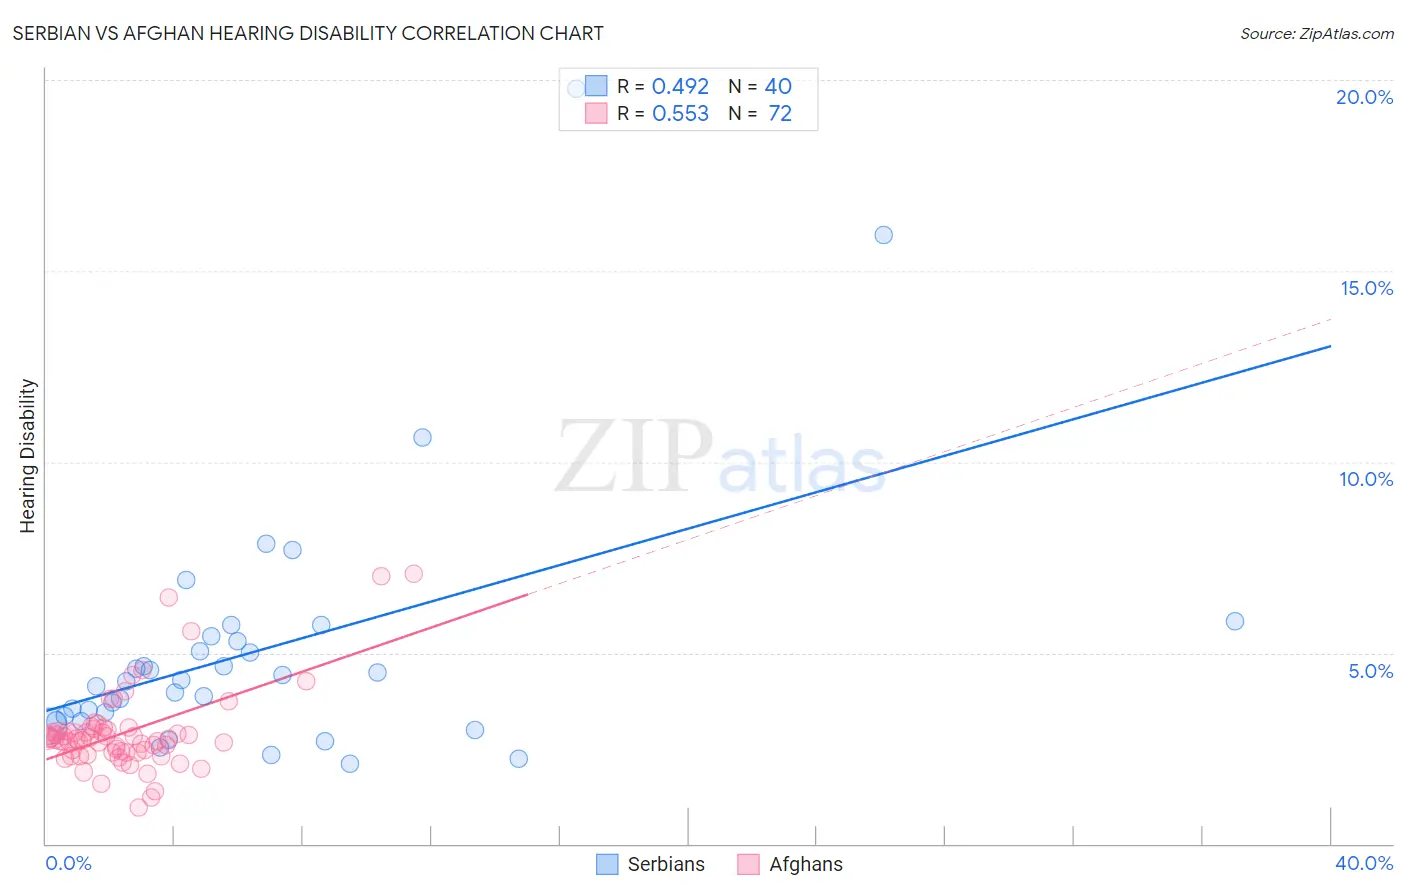
Serbian vs Afghan Hearing Disability Correlation Chart
The statistical analysis conducted on geographies consisting of 267,622,098 people shows a moderate positive correlation between the proportion of Serbians and percentage of population with hearing disability in the United States with a correlation coefficient (R) of 0.492 and weighted average of 3.3%. Similarly, the statistical analysis conducted on geographies consisting of 148,839,750 people shows a substantial positive correlation between the proportion of Afghans and percentage of population with hearing disability in the United States with a correlation coefficient (R) of 0.553 and weighted average of 2.7%, a difference of 19.3%.
Hearing Disability Correlation Summary
| Measurement | Serbian | Afghan |
| Minimum | 2.1% | 0.95% |
| Maximum | 19.8% | 7.1% |
| Range | 17.7% | 6.1% |
| Mean | 5.1% | 2.9% |
| Median | 4.3% | 2.7% |
| Interquartile 25% (IQ1) | 3.3% | 2.4% |
| Interquartile 75% (IQ3) | 5.4% | 3.0% |
| Interquartile Range (IQR) | 2.1% | 0.55% |
| Standard Deviation (Sample) | 3.4% | 1.1% |
| Standard Deviation (Population) | 3.4% | 1.1% |
Similar Demographics by Hearing Disability
Demographics Similar to Serbians by Hearing Disability
In terms of hearing disability, the demographic groups most similar to Serbians are Guamanian/Chamorro (3.3%, a difference of 0.060%), Central American Indian (3.3%, a difference of 0.17%), Estonian (3.3%, a difference of 0.24%), Immigrants from Austria (3.3%, a difference of 0.39%), and German Russian (3.3%, a difference of 0.39%).
| Demographics | Rating | Rank | Hearing Disability |
| Maltese | 4.1 /100 | #229 | Tragic 3.2% |
| Greeks | 3.2 /100 | #230 | Tragic 3.2% |
| Luxembourgers | 2.9 /100 | #231 | Tragic 3.2% |
| Ukrainians | 2.9 /100 | #232 | Tragic 3.2% |
| Estonians | 2.4 /100 | #233 | Tragic 3.3% |
| Central American Indians | 2.3 /100 | #234 | Tragic 3.3% |
| Guamanians/Chamorros | 2.2 /100 | #235 | Tragic 3.3% |
| Serbians | 2.2 /100 | #236 | Tragic 3.3% |
| Immigrants | Austria | 1.8 /100 | #237 | Tragic 3.3% |
| German Russians | 1.8 /100 | #238 | Tragic 3.3% |
| Nepalese | 1.2 /100 | #239 | Tragic 3.3% |
| Immigrants | Netherlands | 1.1 /100 | #240 | Tragic 3.3% |
| Samoans | 1.1 /100 | #241 | Tragic 3.3% |
| Yugoslavians | 1.0 /100 | #242 | Tragic 3.3% |
| Immigrants | Western Europe | 1.0 /100 | #243 | Tragic 3.3% |
Demographics Similar to Afghans by Hearing Disability
In terms of hearing disability, the demographic groups most similar to Afghans are Argentinean (2.7%, a difference of 0.080%), Immigrants from Korea (2.7%, a difference of 0.080%), Central American (2.7%, a difference of 0.10%), Immigrants from Saudi Arabia (2.7%, a difference of 0.11%), and Asian (2.7%, a difference of 0.11%).
| Demographics | Rating | Rank | Hearing Disability |
| Immigrants | Nepal | 98.3 /100 | #65 | Exceptional 2.7% |
| Immigrants | Belize | 98.2 /100 | #66 | Exceptional 2.7% |
| Egyptians | 98.1 /100 | #67 | Exceptional 2.7% |
| Immigrants | Africa | 98.0 /100 | #68 | Exceptional 2.7% |
| Nicaraguans | 97.9 /100 | #69 | Exceptional 2.7% |
| Peruvians | 97.7 /100 | #70 | Exceptional 2.7% |
| Central Americans | 97.7 /100 | #71 | Exceptional 2.7% |
| Afghans | 97.6 /100 | #72 | Exceptional 2.7% |
| Argentineans | 97.5 /100 | #73 | Exceptional 2.7% |
| Immigrants | Korea | 97.5 /100 | #74 | Exceptional 2.7% |
| Immigrants | Saudi Arabia | 97.5 /100 | #75 | Exceptional 2.7% |
| Asians | 97.5 /100 | #76 | Exceptional 2.7% |
| Immigrants | Malaysia | 97.5 /100 | #77 | Exceptional 2.7% |
| Mongolians | 97.4 /100 | #78 | Exceptional 2.7% |
| Colombians | 97.4 /100 | #79 | Exceptional 2.7% |