Czechoslovakian vs Afghan Hearing Disability
COMPARE
Czechoslovakian
Afghan
Hearing Disability
Hearing Disability Comparison
Czechoslovakians
Afghans
3.6%
HEARING DISABILITY
0.0/ 100
METRIC RATING
275th/ 347
METRIC RANK
2.7%
HEARING DISABILITY
97.6/ 100
METRIC RATING
72nd/ 347
METRIC RANK
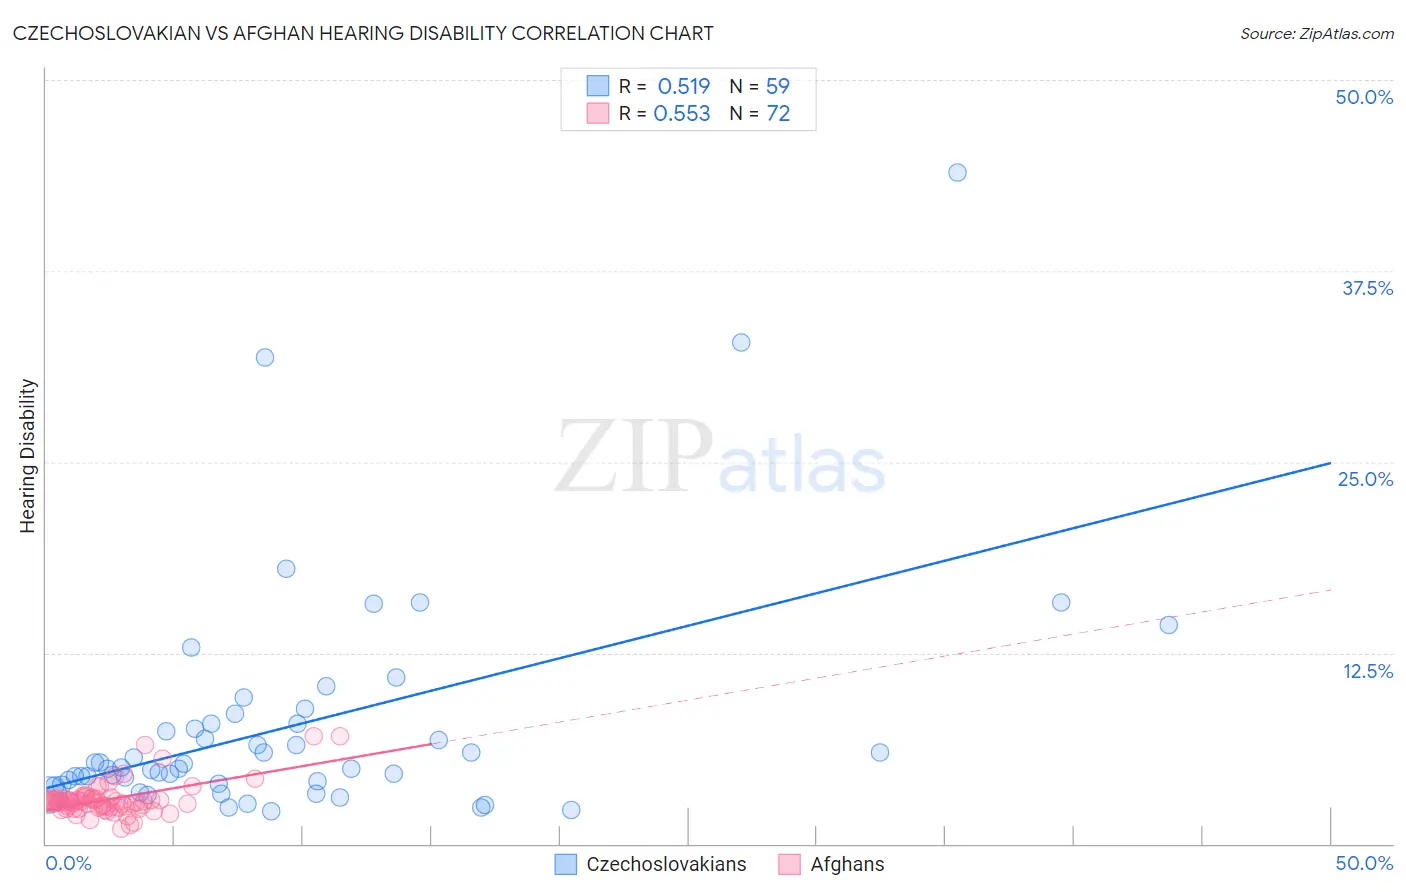
Czechoslovakian vs Afghan Hearing Disability Correlation Chart
The statistical analysis conducted on geographies consisting of 368,630,521 people shows a substantial positive correlation between the proportion of Czechoslovakians and percentage of population with hearing disability in the United States with a correlation coefficient (R) of 0.519 and weighted average of 3.6%. Similarly, the statistical analysis conducted on geographies consisting of 148,839,750 people shows a substantial positive correlation between the proportion of Afghans and percentage of population with hearing disability in the United States with a correlation coefficient (R) of 0.553 and weighted average of 2.7%, a difference of 29.9%.
Hearing Disability Correlation Summary
| Measurement | Czechoslovakian | Afghan |
| Minimum | 2.1% | 0.95% |
| Maximum | 44.0% | 7.1% |
| Range | 41.8% | 6.1% |
| Mean | 7.8% | 2.9% |
| Median | 5.0% | 2.7% |
| Interquartile 25% (IQ1) | 3.9% | 2.4% |
| Interquartile 75% (IQ3) | 7.9% | 3.0% |
| Interquartile Range (IQR) | 4.0% | 0.55% |
| Standard Deviation (Sample) | 7.7% | 1.1% |
| Standard Deviation (Population) | 7.6% | 1.1% |
Similar Demographics by Hearing Disability
Demographics Similar to Czechoslovakians by Hearing Disability
In terms of hearing disability, the demographic groups most similar to Czechoslovakians are Danish (3.6%, a difference of 0.12%), Swiss (3.5%, a difference of 0.20%), Puerto Rican (3.5%, a difference of 0.53%), Fijian (3.5%, a difference of 0.60%), and Nonimmigrants (3.6%, a difference of 0.82%).
| Demographics | Rating | Rank | Hearing Disability |
| Spaniards | 0.1 /100 | #268 | Tragic 3.5% |
| Ute | 0.1 /100 | #269 | Tragic 3.5% |
| Europeans | 0.1 /100 | #270 | Tragic 3.5% |
| Czechs | 0.1 /100 | #271 | Tragic 3.5% |
| Fijians | 0.0 /100 | #272 | Tragic 3.5% |
| Puerto Ricans | 0.0 /100 | #273 | Tragic 3.5% |
| Swiss | 0.0 /100 | #274 | Tragic 3.5% |
| Czechoslovakians | 0.0 /100 | #275 | Tragic 3.6% |
| Danes | 0.0 /100 | #276 | Tragic 3.6% |
| Immigrants | Nonimmigrants | 0.0 /100 | #277 | Tragic 3.6% |
| Basques | 0.0 /100 | #278 | Tragic 3.6% |
| Slovaks | 0.0 /100 | #279 | Tragic 3.6% |
| French American Indians | 0.0 /100 | #280 | Tragic 3.6% |
| Scandinavians | 0.0 /100 | #281 | Tragic 3.6% |
| Swedes | 0.0 /100 | #282 | Tragic 3.6% |
Demographics Similar to Afghans by Hearing Disability
In terms of hearing disability, the demographic groups most similar to Afghans are Argentinean (2.7%, a difference of 0.080%), Immigrants from Korea (2.7%, a difference of 0.080%), Central American (2.7%, a difference of 0.10%), Immigrants from Saudi Arabia (2.7%, a difference of 0.11%), and Asian (2.7%, a difference of 0.11%).
| Demographics | Rating | Rank | Hearing Disability |
| Immigrants | Nepal | 98.3 /100 | #65 | Exceptional 2.7% |
| Immigrants | Belize | 98.2 /100 | #66 | Exceptional 2.7% |
| Egyptians | 98.1 /100 | #67 | Exceptional 2.7% |
| Immigrants | Africa | 98.0 /100 | #68 | Exceptional 2.7% |
| Nicaraguans | 97.9 /100 | #69 | Exceptional 2.7% |
| Peruvians | 97.7 /100 | #70 | Exceptional 2.7% |
| Central Americans | 97.7 /100 | #71 | Exceptional 2.7% |
| Afghans | 97.6 /100 | #72 | Exceptional 2.7% |
| Argentineans | 97.5 /100 | #73 | Exceptional 2.7% |
| Immigrants | Korea | 97.5 /100 | #74 | Exceptional 2.7% |
| Immigrants | Saudi Arabia | 97.5 /100 | #75 | Exceptional 2.7% |
| Asians | 97.5 /100 | #76 | Exceptional 2.7% |
| Immigrants | Malaysia | 97.5 /100 | #77 | Exceptional 2.7% |
| Mongolians | 97.4 /100 | #78 | Exceptional 2.7% |
| Colombians | 97.4 /100 | #79 | Exceptional 2.7% |